|
| |  GeoSatSignal
download GeoSatSignal
download
 GeoSatSignal
mini-tutorial GeoSatSignal
mini-tutorial
 GeoSatSignal
registration - help support continued development! GeoSatSignal
registration - help support continued development!
What is GeoSatSignal?
GeoSatSignal is a development of my SatSignal
program, designed to process geostationary satellite data. Because the
data is a sequence of images from the same well-defined location, more exciting
processing can be done, and GeoSatSignal allows you to combine data in a number of ways:
- from multiple channels to produce a false-colour image,
including channel differences
- from multiple segments of a single satellite view
(such as those transmitted by GOES & MTSAT)
- from multiple satellites to produce a world view
- from multiple times to produce an animation
- correct data to standard map projections
- display satellite images on top of meteorological charts
Please note that GeoSatSignal is an original piece of software
developed independently by SatSignal Software, Edinburgh specifically for users
such as you, and there is a lot of direct user input in the design of the
software. This is not a re-branded program originally developed by someone
else. This allows a rapid response to the ever increasing variety of data
available.
Who uses GeoSatSignal?
GeoSatSignal is used by many leading Universities and Research
Institutions. Many National Weather services and some Airport Weather
services use the software, and some of my most recent customers have been teams
from the Volvo Ocean Race 2005-2006!
I welcome your
suggestions for facilities which you would like to see in the program.
You can see what some people are doing with the program from these sample image
sites.
Sample GeoSatSignal Image sites
These articles are written by the long-time geostationary
weather satellite expert, Douglas Deans, and may help put the usage of
GeoSatSignal into perspective. They were written before and during the
initial trials of the Meteosat Second Generation satellite (MSG-1), now
Meteosat-8. They are all PDF format files.
Facilities include
- Process many standard image file formats
- Longitude and latitude display on images
- Accurate temperature readout from digital images
- Make false colour images from visible and thermal channels
- Histogram equalisation, gain-stretch, crispening, sea-blue
enhancements
- Apply NOAA GOES Enhancement curves
- Rectify images to various projections, e.g. to help remove the image distortion at higher
latitudes
- Add longitude/latitude graticule to rectified images
- User-defined re-mapping regions
- Add Bracknell or other MSLP overlay - a weather chart on top of the
image
- Animation with variable sampling interval and frame time
- Automation with command-line parameters for complete
hands-off operation
- Automated Internet data retrieval with AutoGet
- Meteosat-8, 9 and 10 support
- support for the MSG-1/2/3 HRIT & LRIT scan mappings
- support MSG-1/2/3 file names
- support for full-scan and Rapid Scan services
- introduce new false-colour RGB combinations
- GOES full disk data support from GOES
East and GOES West Web
data
- Ability to use your own images as backgrounds (allows simulation of
permanent daylight conditions with cloud overlays)
- Multiple text annotation overlays
- Control of text style in annotation overlays
- Nearest city indication when moving cursor
- Automatic
<year><month><day><hour><minute> string
replacement in batch-mode output file naming
- Control of minimum and maximum temperatures in job for pure
temperature false-colour output
Processing of historical WEFAX data
- Join WEFAX images with automatic registration
- Join C02 and C03 images
- Join Meteosat visible, IR or WV segments 1,2 and 3
- Join Meteosat segments 1 and 4
- Join Meteosat segments 6 and 9
- Join all nine Meteosat segments 1 to 9 for a full disk
image
- Join GOES-E or GOES-W NW and NE segments
- Join MTSAT segments A, B, C and D for a full disk image
- Processing of saved Timestep
format .dat files
- Accept Timestep MPD, Data Tools MET, Dundee PDU and Rob
Alblas format files
- Rectify C02/C03 and other European sectors to Polar
Stereographic or Orthographic projection
- Rectify southern hemisphere sectors
Can I register and what do I get?
As with my other software
packages, registration is required for continued use, and for technical support other than via the
self-help e-mail list. You can register here.
Please note that you can e-mail me
directly for support only if you are a registered user.
| V8.0.2 |
Look for E-UNS Admin notices if available.
|
| V8.0.4 |
Start Himawari-8 support (thermal channels calibrated (GOES mode-A from
the MSG Data Manager), support geographic remapping, includes land/sea mask, support background mode, recognise Himawari in satellite text name overlay, replace MTSAT with Himawari-8 in
Browse|EUMETCast|FSD, recognise WV image, support in World view, support so-called "natural colour" [EUMETSAT: R3G2B1] NDVI and arbitrary RGB combinations), correct V7 in the title bar to V8, correct Help|About to read "Available" virtual memory.
|
| V8.1.2 |
Start support for MSG IODC coverage (basic
channels work, RGB works, animations work, EUMETCast browser updated,
backgrounds work), support Dundee Himawari data, support Himawari ch.6
(2.3 �m) for RGB (new channels selected and work on RGB presets), add
3840 x 2160 resize (for 4K monitors), add 3600 x 1800 World View option,
handle transparent PNG logo files, better naming of RGB thumbnails,
protect against errors in world view image refresh.
|
| V8.1.4 |
Update Himawari and MSG/IODC land/sea masks.
|
| V8.1.6 |
Update MSG/RSS land/sea masks.
|
| V8.1.8 |
Add HRV/full land/sea mask support.
|
| V8.2.2 |
Support MSG/IODC & GOES-16 in World
View, support for Himawari B12 (as IR_096), support GOMS-2 including
remapping, don't show Notice of the Day dialog if the directory doesn't
exist, widen LUT drop-down boxes on Job Setup form, correct IODC land/sea
mapping, correct 2300 + 1 hour TZ bias displaying day incorrectly, start
GOES-16 support (rectification offset point is 75� W, country boundaries
supported, land/sea LUTs supported, RGB combinations preliminary support,
a few suggested RGB added including night microphysics (note the revised
format just for GOES-ABI data), file names matching the GOES ABI Manager
format (201711071600-g16-b13.jpg), note that data is preliminary, may not
map correctly), setup option for lower-case saved file names, correct
"Space is grey" in GOES-16 world view, parallel-scan thermal
files are GOES-mode-A, FY-2E (labelled fy2d) etc. thermal files are
GOES-mode-A, support GSHHG 2.3.7 shoreline & country bondary data
format, correct missing User2 boundaries, add GPX to boundary File|Open
list.
|
| V8.2.4 |
Support ppag50bw.gif overlay (1728 x 1100
pixels), restore support for boundary data with spaces in the file name,
update Himawari RGB naming to 16-channel B01..B16, Start RGB support for
Himawari ("H-Pure RGB" correct, "H-Airmass" useable,
"B03" accepted as well as "vis"), add XL world
remapping (11000 x 5500), add GeoTIFF output for World View, update
EUMETCast browser for GOES-E/W being GOES-16/17, remove Met-7, update
GOES-16 mapping for non-standard American projection, including in World
View, increase the GOES-E coverage in World View, try to optimise World
View for missing or partial GOES-W, support native GOES-17 in World View,
temporary fixes for GOES-15 at 128� W including world view, added 128� W
land/sea mask, start GOES-17 at 137� W support, add GeoTIFF output for
Plate-Carre� projection, extend allowed latitude and longitude spans
when remapping, add magnification setting for city marker text.
|
| V8.2.6 |
Change to user licence key for
faster start-up - re-enter your existing key but without Run as
Administrator.
Start FY-2H support, start IODC at 45.5 degrees support - IODN image files
required, file|browse EUMETCast updated, recognise IODN and FY-2H in
World View, support PPVA.gif overlay 1076x790 pixels with more tolerance
on the file name - latest used, add pop-up hint to IR thumbnail with file
and overlay paths, add 5000x5000 remapping, faster remapping (with new
runtimes), trap error at program exit on a couple of systems where
HTMLhelp may not be installed? New runtime
Library Bundle optional.
|
Important: This program includes a 30-day trial licence, so that you be
sure the program does what you want before purchasing. Please
wait until you have data to test before installing the program, as the
30-day countdown starts from the first time the program is run and cannot be
reset.
Beta version: This program is under continual
development - check here
for the latest update.
Hardware requirements
GeoSatSignal has been developed on PCs with 500 MHz and higher processors and
512 MB or more of memory, and this is the very minimum specification recommended. Windows XP
is the earliest version of Windows still supported. The remapping and animation functions are the most time-consuming, and processing multiple 5000 x 5000 pixel pictures will
require substantial memory. That's 25 MB for visible, 25 MB for IR, 75 MB for
false-colour - i.e. 125 MB for images alone. Your display should be at
least 800 x 600 pixels with 15-, 16- 24- or 32-bit colour. For larger
images such as some Meteosat-8/9/10 work, 1GB of memory and a 2GHz
processor are working minimum specifications, with 2-3 GB of memory and faster processors providing a more comfortable user experience with HRV
image data. A beta version is available allowing up
to almost 4 GB of virtual memory on 8 GB Win-7/64 PCs, allowing processing of
the larger images and remappings.
Be sure
to calibrate your
monitor.
Required libraries
- All required libraries for
GeoSatSignal (which you may already have)
- Register
GeoSatSignal
- There is a special offer including GeoSatSignal, the MSG Data Manager and the MSG Animator
in the MSG Toolset
Plus package.
- Join the self-help
group for GeoSatSignal.
- Guidelines
on publishing EUMETSAT data.
- Country boundary overlay file - in
countries.zip
- City data file - in
cities.zip
- German city data file from Andrew Hall - in
Cities-Deutschland.zip
- Be sure to calibrate
your monitor correctly for best results.
- Make your own background images for the Background Overlay
mode - use MapToGeo. A 30-day
trial version is available for download.
- AutoGet
V4.4.4 - get image files off the Internet from
popular Web and FTP sites
- This program can completely automate retrieval of selected data from
the Dundee, EUMETSAT and GSFC Web sites, and much other weather data. Use the Windows
Scheduler to determine when AutoGet runs, and choose what data you want
within AutoGet. Worth downloading just for the read-me
file on data sources!
Recommended Bracknell URL: http://www.wetterzentrale.de/pics/bracka.gif
Included in the GeoSatSignal-7 installation, but the version here may
be more recent. AutoGet is a free and unsupported utility.
- Thanks to Francis Breame, there is now a completely
user-programmable alternative to AutoGet called getCharts, which is
available for download from: http://www.elnath.org.uk/
-
brackachart.zip - Götz Romahn has kindly
provided a Perl script based on Francis Breame's work called brackachart.
"I have adapted -- or better say specialized -- Francis Breame's script to fetch Bracknell charts for overlay in
GeoSatSignal. The intention was to make it somewhat more user friendly and compliant with the directory structure used by
the MSG Data Manager and GeoSatSignal i.e. \%yyyy\%mm\%dd."
-
Sample CLUTs, jobs and other
submissions from the User Community (1088KB zip file, 2009 Aug 21)
- Colour Lookup Tables (CLUTs)
-
TonLindemann-LUTs-ENH2.zip (1.8MB) -
stepped and smooth CLUTs from Dutch weather expert Ton Lindemann,
including superb documentation. Worth the download for the
documentation alone! The LUTs look for cold cloud tops allowing easier
recognition of possible
rainfall and severe weather. The CLUTs supporting the land-sea masks
now use the full range of -120°C to 60°C. Shaded colours from -85° to
+60°C; from -120°C to -85°C a uniform colour. Because of lowest
temperatures in earth's atmosphere are around -80°C the range -120°C
to -85°C is not used for shading. The read-me is also updated with more
information about meteorological use of enhancement of IR-satellite
imagery. You can also refer to Ton's Web site
(only in
Dutch)
- Nederlandstalige
informatie over GeoSatSignal en Autoget.
-
Nederlandstalige leesmij.txt for
GeoSatSignal and Autoget from Ton Lindemann
- Convert Timestep .DAT files directly to JPG or BMP images -
simply drag-and-drop a .DAT file from Explorer.
- Rename Timestep .MPD files into a standard naming
convention to allow animation with GeoSatSignal
- Convert GOES WEFAX images (with
a binary header) to the correct width, brightness range and animation naming
standard for GeoSatSignal.
- Rik Wessels' tutorial on using
overlays with GeoSatSignal
- Convert AVI files to Windows Movie files from the command
line with the Windows
Media Encoder from Microsoft. The command-line tool is supposedly
in the Windows
Media Encoder SDK, but I haven't used it myself.
- Ton Lindemann's volcanoes
database - you can use this like a cities file (updated 2012-Nov-06).
- Roman Zamiesal's paper on Airmass
with best match to EUMETSAT's colours. Please be aware that altering
the transfer characteristics for channels 5 and 6 in the MSG Data Manager
will invalidate the temperature calibration as displayed in GeoSatSignal, so
please use caution when making these changes. Updated 2013-Oct-28.
- Roman Zamiesal's paper on
Convective Storms
with best match to EUMETSAT's colours. Please be aware that altering
the transfer characteristics for channels 5 and 6 in the MSG Data Manager
will invalidate the temperature calibration as displayed in GeoSatSignal, so
please use caution when making these changes. New 2014-Jan-02.
- Designing LUTs is as much an art as a science, and to get the best out
of the data you may different LUTs for different times of the year, or for different regions (warm versus cold).
- In "Background mode", the LUT works on the temperature of the infra-red
channel, operating on each pixel according to the brightness temperature of the image.
Of course, colder temperatures are usually associated with clouds bearing more rain, so it makes sense to colour those regions
distinctively - either with white (so that they stand out), or with black (so they look like dark clouds approaching), or with an artificial colour
such as red so that they stand out. The precise temperature at which you
switch from background image pixels to cloud image pixels will depend on the ambient conditions, so that a different LUT may need to be chosen
depending on the region or season being viewed.
- A refinement in "Background mode" is that in addition to the RGB colour
specified for the cloud at each particular temperature, you can also specify a transparency of the cloud colour, so that a fraction of the
background image pixel shows through as well. This allows cold storm-bearing clouds to be shown as solid masses, but warmer cloud to be
shown as "thin" cloud, i.e. with a greater transparency.
- A Background-mode LUT is specified as a Windows BMP - either 100 pixels
or 361 pixels wide, and two lines high. The horizontal axis of the LUT
corresponds to temperature. In the case of the 100 pixel wide LUT, the range is from -60C on the left to +39C on the right, in one degree steps.
The 361 pixel wide LUT corresponds to a wider range of temperatures - from -120C to +60C in 0.5C steps.
For typical use, the 100 pixel wide LUT provides adequate thermal resolution.
The top line of the LUT defines the "cloud" colour, and the bottom line the opacity of the cloud colour
(0..255).
- Taking a LUT such as the supplied LutLightClouds-B.bmp, the top line
shows the basic temperature to colour mapping, with the coldest clouds mapped to a white colour (X=0, R=G=B=255), and the warmest clouds mapped
to a dark grey colour (X=69, R=G=B=87). The X value corresponds to a temperature of 9C, quite warm for a cloud.
The bottom line determines the opacity of the "cloud" pixel, and the opacity varies along the temperature
scale. At X=0, the lowest temperature of -60°C, the opacity is 100% (defined by the R=G=B=255 value), so the transparency is zero, and none of
the background image shows through. At X=55 (corresponding to a temperature of -5°C), the opacity is just under 50% (R=G=B=123), so the
transparency showing the background pixel if just over 50%. At X=69 and
greater, corresponding to temperatures of 9°C and greater, the opacity is zero, and all the background image shows clearly through.
- You can edit LUTs with any normal image processing program such as Paint
Shop Pro. However, be sure to keep the format of the LUT exactly the same
when you edit - 24-bit colour LUTs with the specified image sizes are the only ones which will be recognised by the program.
These notes were kindly provided by Ton Lindemann.
Using the EUMETSAT archives for Meteosat data
EUMETSAT is offering a large free archive for his satellites from Meteosat
1 to the current. All data can be ordered online and delivered on several ways, as on DAT-tape, CD, DVD, hardcopy, pushed FTP or by download via http.
By the end of 2005 all the data can be ordered by the new U-MARF (EUMETSAT's archive) online at no costs.
GeoSatSignal supports for Meteosat-1 to Meteosat-7 the 0°, 10°E (Meteosat-6) and 63°
(Meteosat-5) services.
GeoSatSignal supports only the OpenMTP format for the northern hemisphere for
Meteosat-1 to Meteosat-7 0°-services, and you can choose for Meteosat-8
the PNG-greyscale as format option for use with GeoSatSignal. The Meteosat-8
image data may need to be processed with GSSprepare first before you can use it in GeoSatSignal.
It should be noted that the historical images (Meteosat-1 to Meteosat-7) can be ordered by EUMETSAT's
order form long as they are not available in U-MARF.
Getting access to the archives
Older information
On the main page of
go to:
Data, products and services, and there to "archived data retrieval services" under "services".
You will find the archives there on the right part of the main screen in the green box.
The first option: "Ordering online" gives you access to the new archive. The last option gives access to the old archive, this for
data which where not transferred already to the new archive. This data must
be ordered by a request form and sent to EUMETSAT. Data from the new archive can be ordered online.
You must register with EUMETSAT before you can use the archive. There is a manual with clear
instructions available about the use of the old and new archive which can be accessed at the documentation page of
EUMETSAT. Search there for the EUM TD 06 and EUM UG 04 documents.
Update - November 2005
At this moment (late November 2005) more than 80% of the old off-line
archives are have been migrated to the new online archive. This means that
you can access almost all the data from all Meteosat satellites back to 1977.
The migration will be completed early 2006. Before you can use the archive and order the data you must register with
EUMETSAT, but this is free.
On the new EUMETSAT Web site, go to:
->Access to data
->User archive
->Online ordering
Click here on <archive online ordering> to get access to the archives.
There is a manual with clear instructions available about the use of the old and new archive which can be accessed at the documentation page of
EUMETSAT. Search there for the EUM TD 06
document.
You can
find it in the documentation section of the EUMETSAT Web site.
|
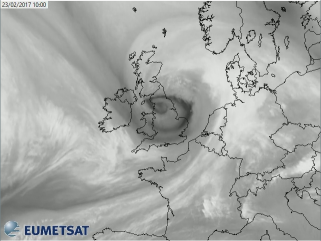
Thermal channel in "background" mode.
|
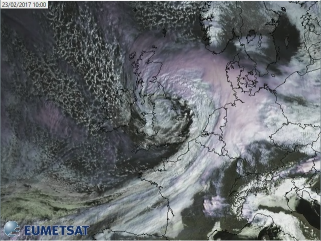
Water-vapour channel
|
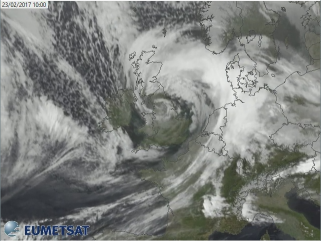
Visible & thermal channels combined
|
Storm Doris hit the UK in late
February 2017, causing some damage and loss of life. Here are three
animations showing different was of using the visible, water-vapour and
thermal channels of EUMETSAT's
Meteosat Second Generation Meteosat-9 satellite, taking advantage of the
Rapid Scanning Service to provide a smooth animation. Click on an
image to see the animation.
|
 |
A winter Meteosat-9 image
processed with a colour lookup table (LUT) palette
designed to produce not only an attractive false-colour image for the land
and sea, but also to show the details of the cold cloud tops using a
palette agreed at the EUMETSAT Convection Working Group.
If you look carefully, you can see what appear to be ship
trails on the extreme left of the image, showing as slighter lighter
tracks in the light grey clouds. A similar palette is available here
for
night-time thermal-channel-only images.
|
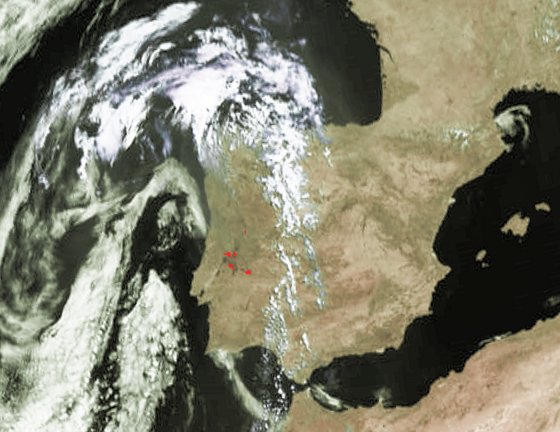 |
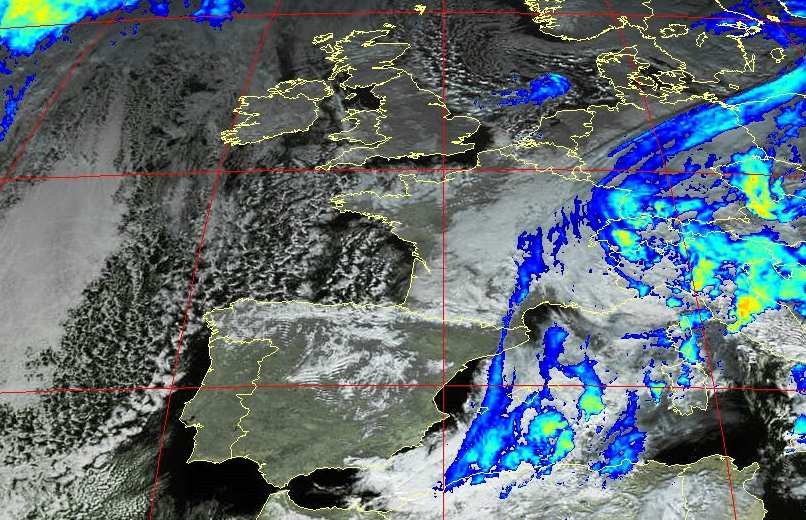
Fires in Portugal using data
from EUMETSAT's Meteosat-8. The visible channel is used to make the
brightness component of the image and a thermal channel is used for the
colouring. The mid-IR channel which is sensitive to fires has been
used to provide the red hotspot overlay.
|
(click for an enlargement) |
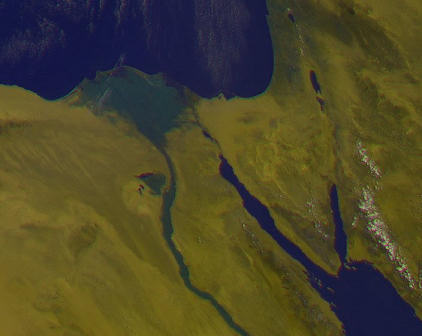
The Nile region on 06 August 2005
at 10:00 UTC using the new RGB false-colour option in GeoSatSignal.
The vegetation stands out clearly in green, obtained by using the visible
waveband channel 1 data for the red image, the high-resolution,
broader-band visible channel for the green image, and the 10.8µm thermal
waveband channel 9 data for the blue image. All data from
Meteosat-8.
|
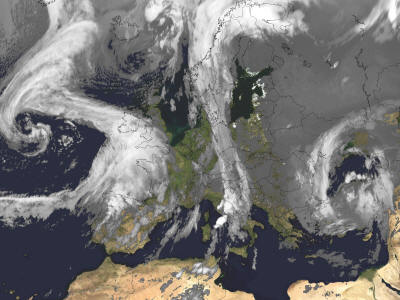
|
Using the background mode in
GeoSatSignal, Ferdinand Valk
produced this image turning night into day! By using data from the
thermal channel, and overlaying it on a "clear-sky" Blue
Marble background image (remapped through MapToGeo),
the cloud data can be easily related to the land masses. This data
was from a winter 1800 UTC scan of Meteosat-8 when much of Europe was in
night-time, yet the image looks like a daylight one!
|
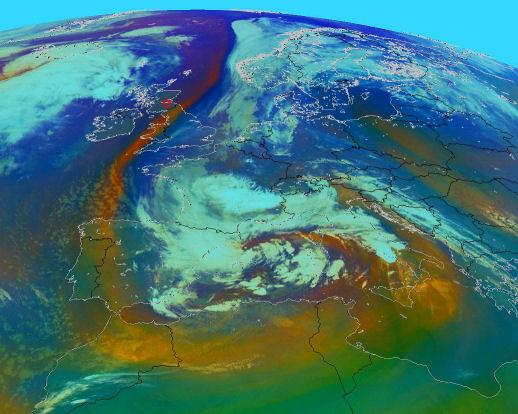
|
Using the new RGB presets in
GeoSatSignal 7, this is an "air-mass" false colour image based
on combining the main thermal channel with the two water-vapour
channels. On this weather situation, Prof. Robert Moore comments
on the GEO-Subscribers self-help group (message 12555: "The current air-mass image shows cold air from the arctic coming right down across the UK and curling around Spain.
Spectacular". Here is a training
module about airmass RGB (takes time to download).
|
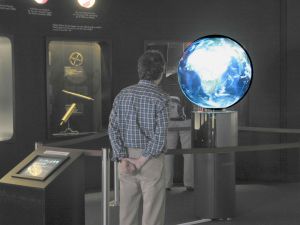 |
GeoSatSignal can combine the
view from multiple satellites from around the globe to produce a composite
World View image. If, like the Deutsches
Museum in Munich, you have an Omniglobe
spherical projector (supplied in Germany by Globoccess)
you can make a current satellite view of the world. Click here
to see the Deutsches Museum facility.
|
Click for an enlargement |
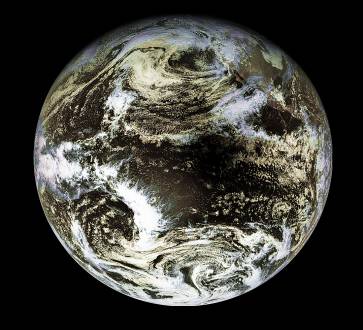
| Solar Eclipse of 2001 Dec 14,
data off the Internet from GSFC from the GOES-W satellite with false-colour
processing. The original image has three times the resolution of
this image. Note the moon's shadow just to the right of centre of
this view over the Pacific Ocean.
|
Click for an enlargement
|
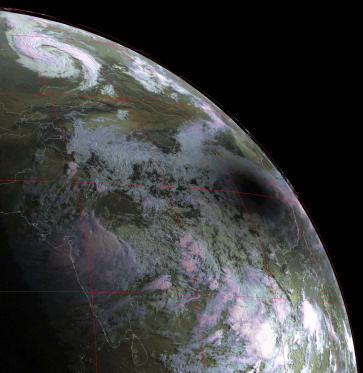
Solar Eclipse of 2009 Jul
22. Data from EUMETSAT's Meteosat-7 satellite situated over the
Indian Ocean.
|
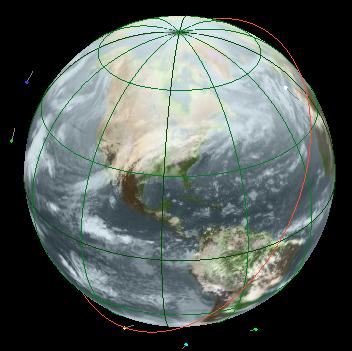 |
| This is from the
World View mode of GeoSatSignal which combines the results of 5 geostationary satellites
around the world into one composite image. The WXtrackGL
program is then used to display the results. You can see the areas
of cloud showing as cold (white) superimposed over a world map
background. Within WXtrackGL, the globe can be rotated to view as you wish.
WXtrackGL is a free and unsupported utility.
|
Click for an enlargement |
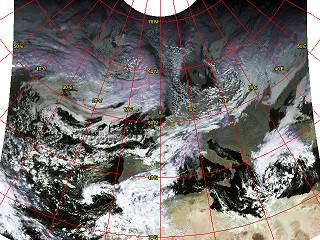
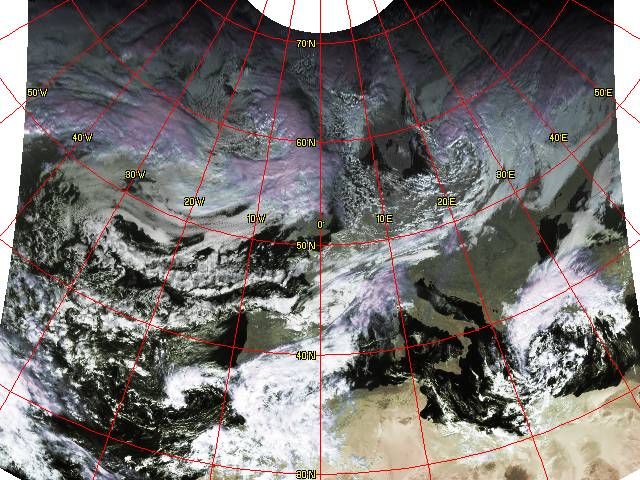
| Meteosat 7 visible and thermal channels combined with
false colouring to show the temperature range. The image has been
rectified to a polar stereographic projection.
|
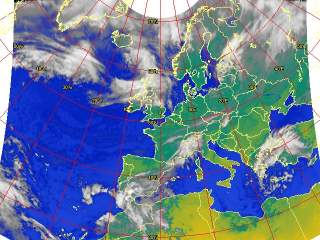
Click for an enlargement |
| The same image as above, but
processed with a 2-channel land-sea mask and country boundaries.
Note the improvements in the image with much better location of the land
masses and elimination of thin cloud.
|
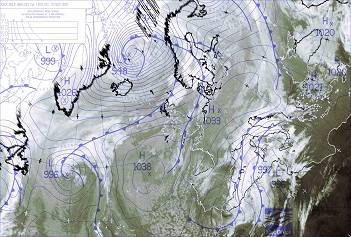
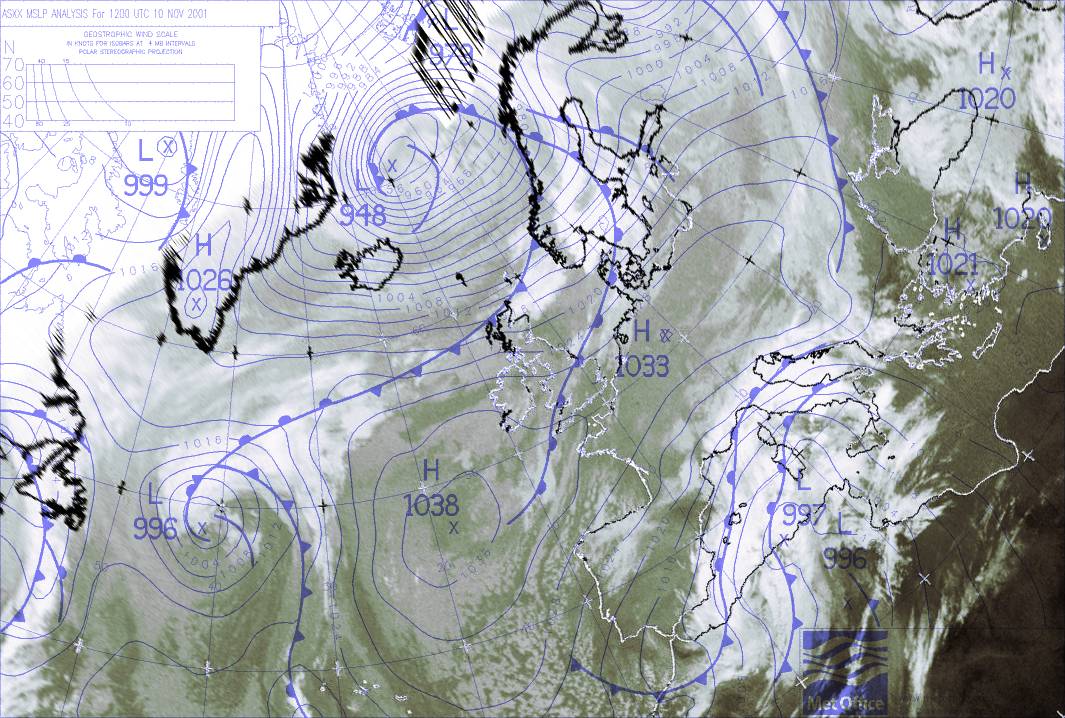
Click for an enlargement |
|
Meteosat D1, D2 and D3 sectors
automatically combined, rectified, and a mean sea-level pressure overlay
from Bracknell has been added. |
|


