Downloading and processing Sentinel 2A data
Obtaining the data
I am new to this, so I would appreciate any comments and corrections to these
notes. They are not intended to be a comprehensive or definitive
guide!
There will be more information in a forthcoming GEO-Quarterly article,
obtained by joining GEO
- the Group for Earth Observation.
The data can be downloaded from the Web, with a graphical interface allowing
date and region selection, with a number of other parameters such as cloud
cover. You can also select a region of interest with a centre latitude and
longitude, and zoom degree, for example, to be centred on Edinburgh:
https://lv.eosda.com/?lat=55.9&lng=-3.2&z=7
- First choose which satellite you wish to view - I selected SENTINEL-2.
- This results in a strip of image tiles on the right-hand side of the
screen, and a grid overlaying your centred region on the left. This
grid is based on the Military_grid_reference_system.
Select your region of interest by clicking on a tile. I haven't yet
found out how to select more than one tile, if that is indeed possible!
- The three-slider icon at the top left of the Scene Search panel allows you
to select images based on various criteria such as year, month, cloudiness,
sun elevation and coverage. The tiles may only cover part of your
region of interest (the Edinburgh ones are at the lower-right of a tile, and
typical scans will cover less than half of that tile, so I would need to
select a coverage of well under 50%). When you have chosen your parameters,
a different set of thumbnail images may be visible. Click the
three-slide icon to close it.
- Click on your selected thumbnail image, and a thumbnail image will appear
over the appropriate region on the map on the left-hand side.
- You can now click on the download icon on the right-hand side. For
the highest resolution, natural-colour image, select bands 2, 3 and 4.
You need to be registered (free) to download data.
This will narrow you down to a selection of data, with a date and tile name
for each selected group:
S2A_tile_20160515_32TLP_0
S2A_tile_20160420_30VVH_0
After downloading, you will end up with three files named, for example:
- B02.jp2 - the blue band
- B03.jp2 - the green band
- B04.jp2 - the red band
These files are in JPEG 2000 format, with 16 bits per pixel for added
precision. Not all image viewing programs will handle this data. I
suggest you rename them with the tile & date name:
- S2A_tile_20160420_30VVH_0-B02.jp2
- S2A_tile_20160420_30VVH_0-B03.jp2
- S2A_tile_20160420_30VVH_0-B04.jp2
There is a guide to the bands available and there resolution and sensitive
wavelengths here.
The only other 10 m resolution data in on band 08, which is in the near
infra-red and can be used to highlight vegetation.
Processing the data
I have written an experimental program to do this, but in essence:
- For each band (red, green, blue) measure the histogram.
- Note the minimum (0.5%) and maximum (99.9%) limits.
- Create a JPEG image with three 8-bit bands, applying a mild gamma
correction.
If you find that you need to combine multiple tiles to get the full image you
want for an area, you can try the program AutoPano
Pro which is available for Windows 32/64, Linux/64 and the Mac. Les
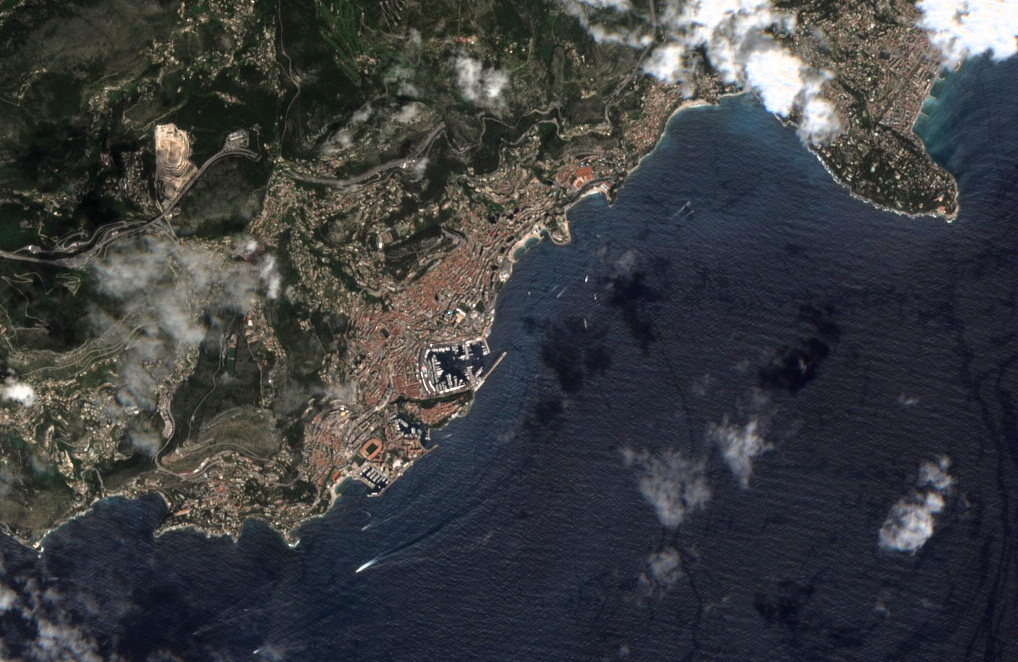
Hamilton put me on to this program, and one of his examples in shown below in
the Majorca image which was made from four Sentinel 2A tiles.
Sample results:
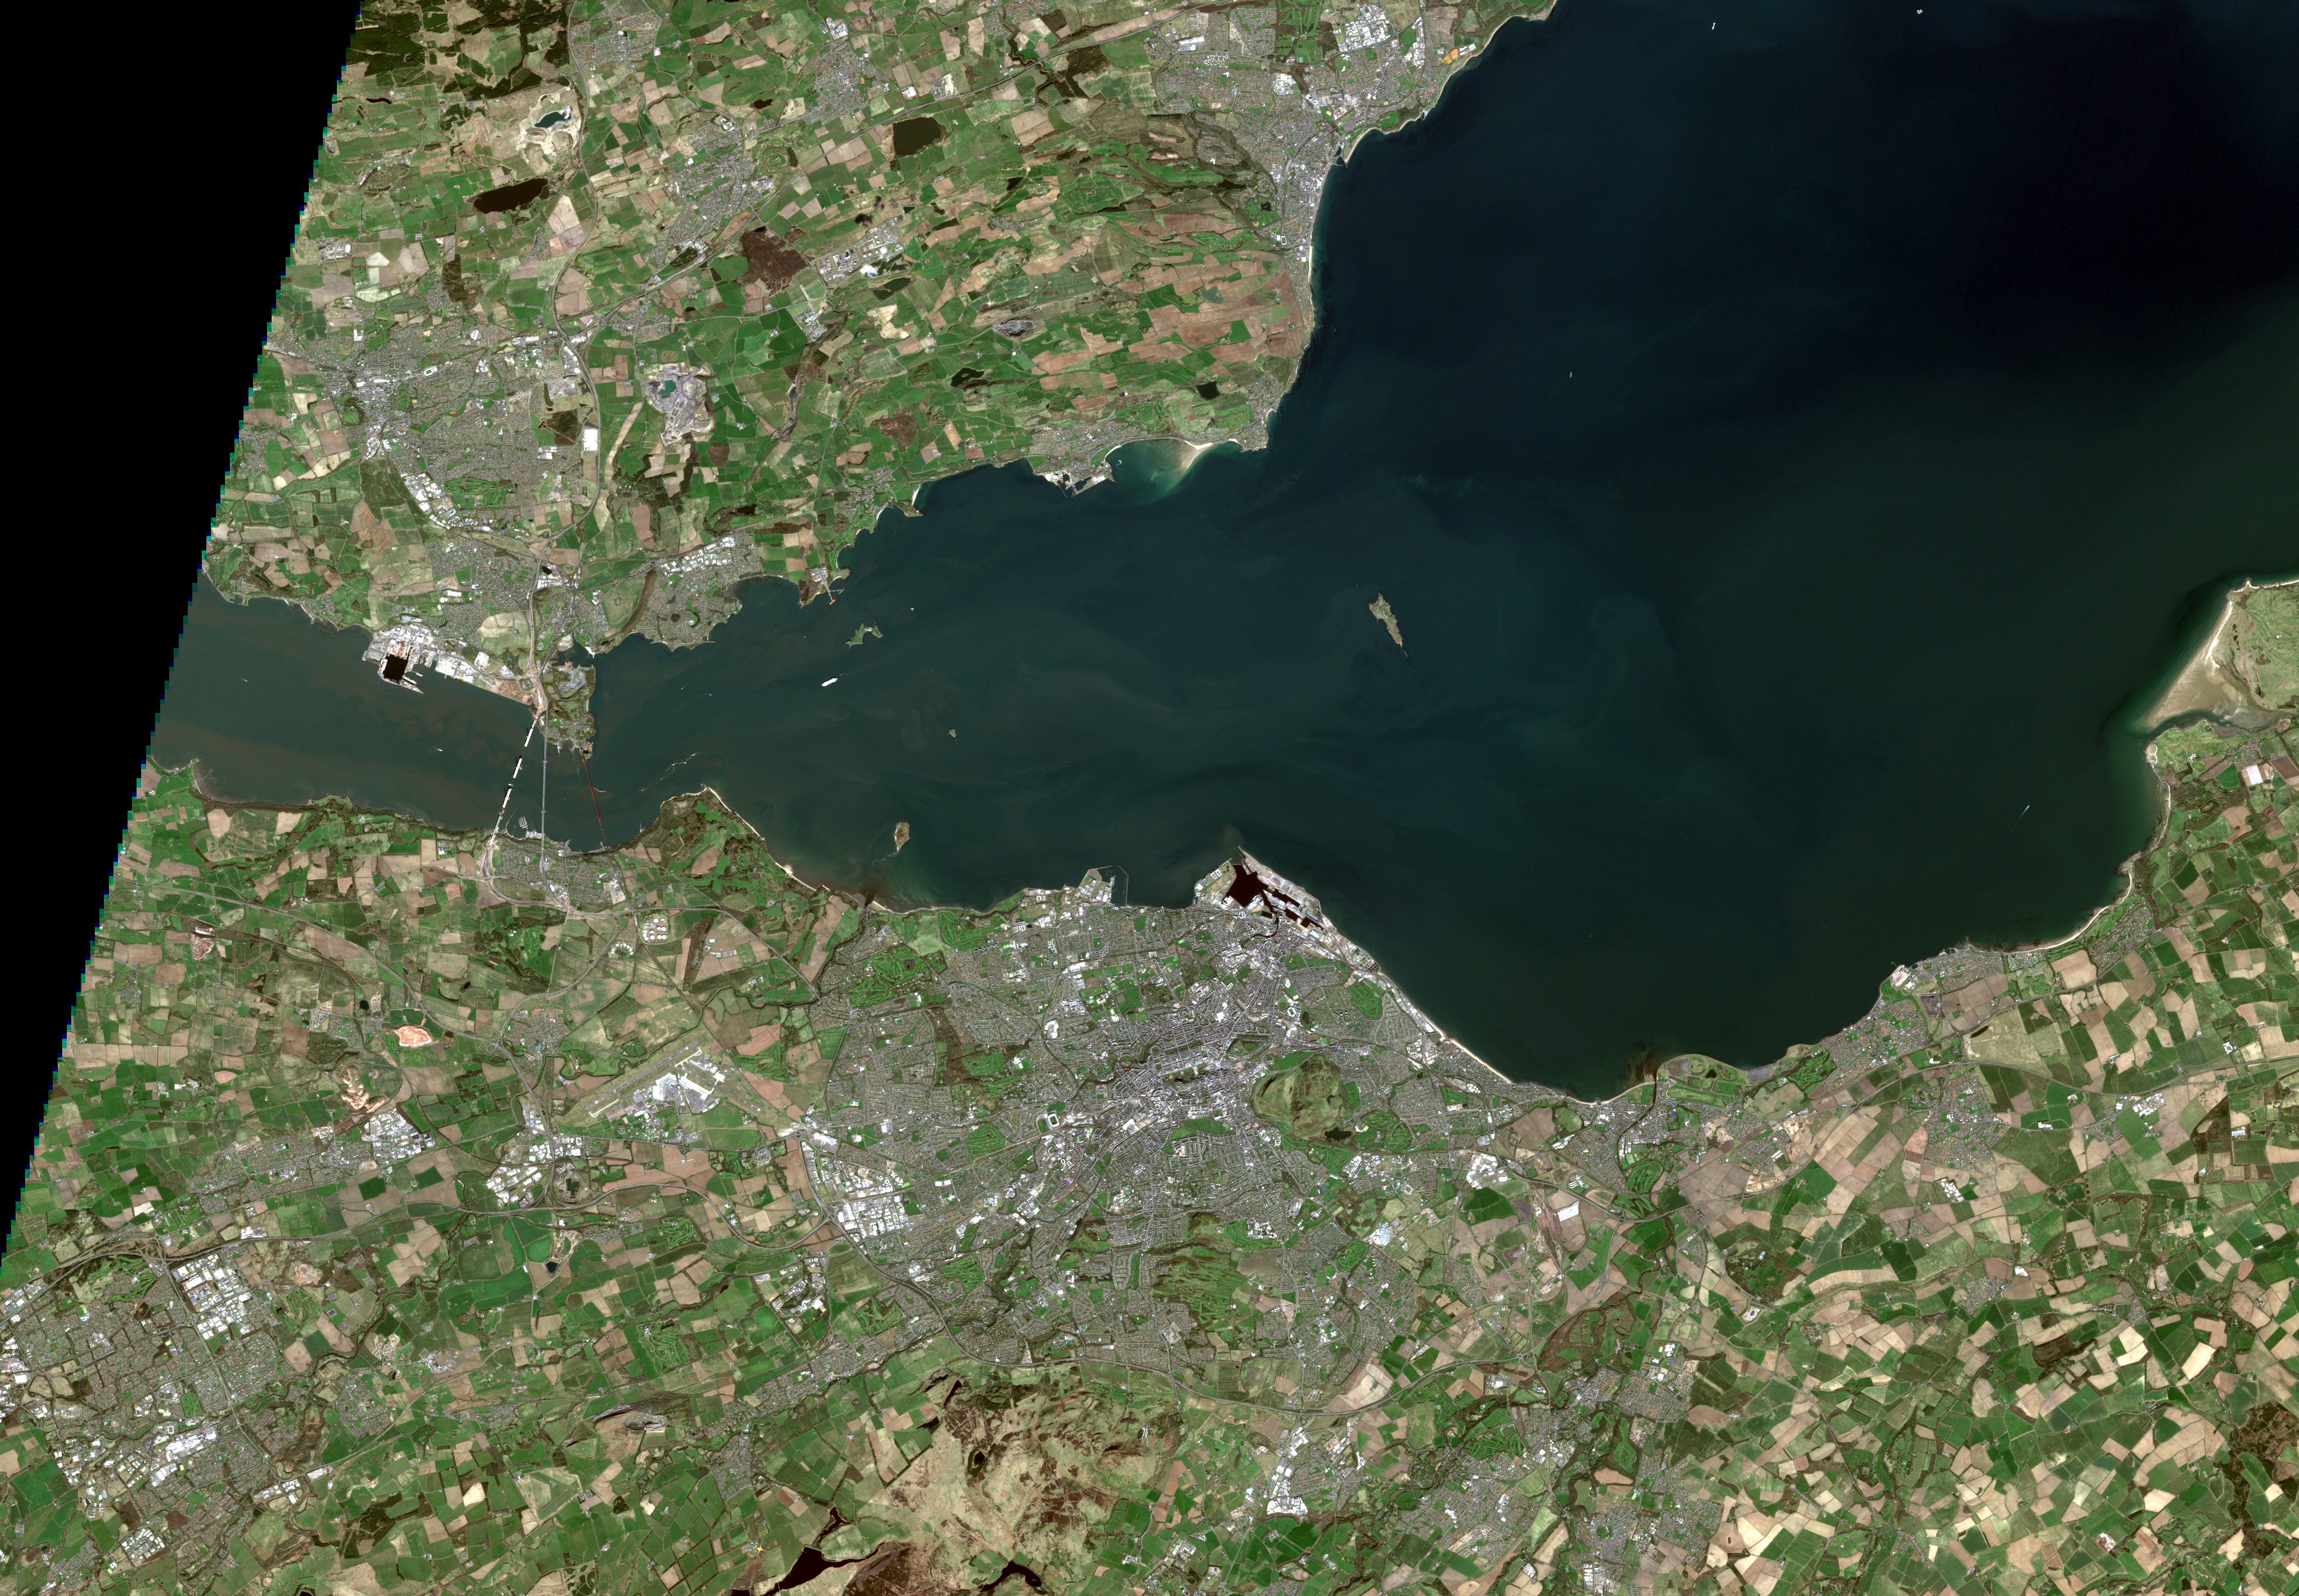
Here is modified Copernicus Sentinel 2A data from 2016-April-20:
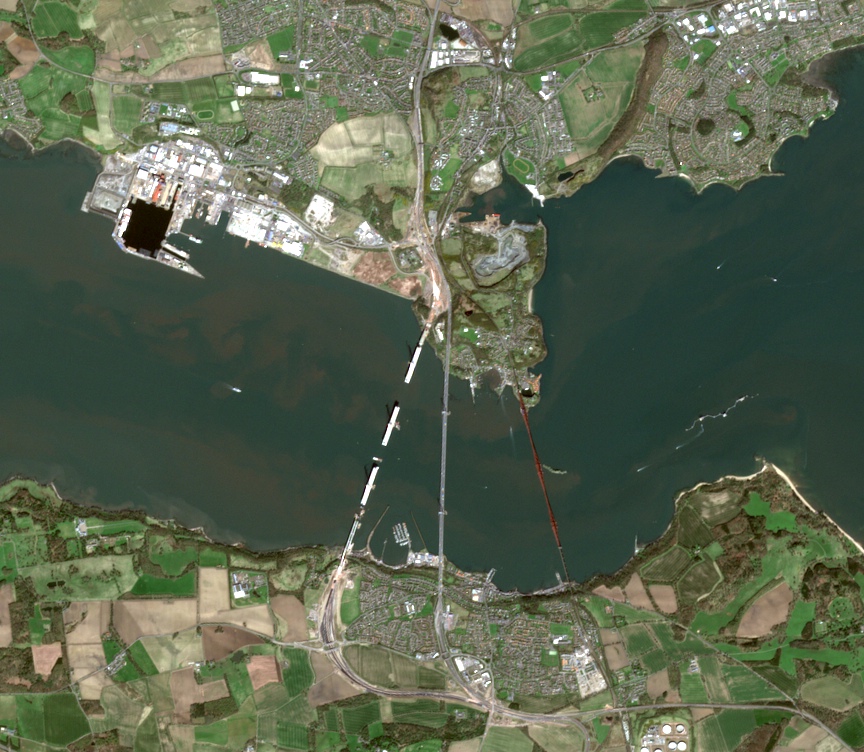
Edinburgh and the three Forth bridges - Queensferry Crossing, the Forth Road
Bridge, and the Forth Rail Bridge - from three different centuries!
The full image is here.
From 2016-May-15. Do you recognise this bit of coastline?
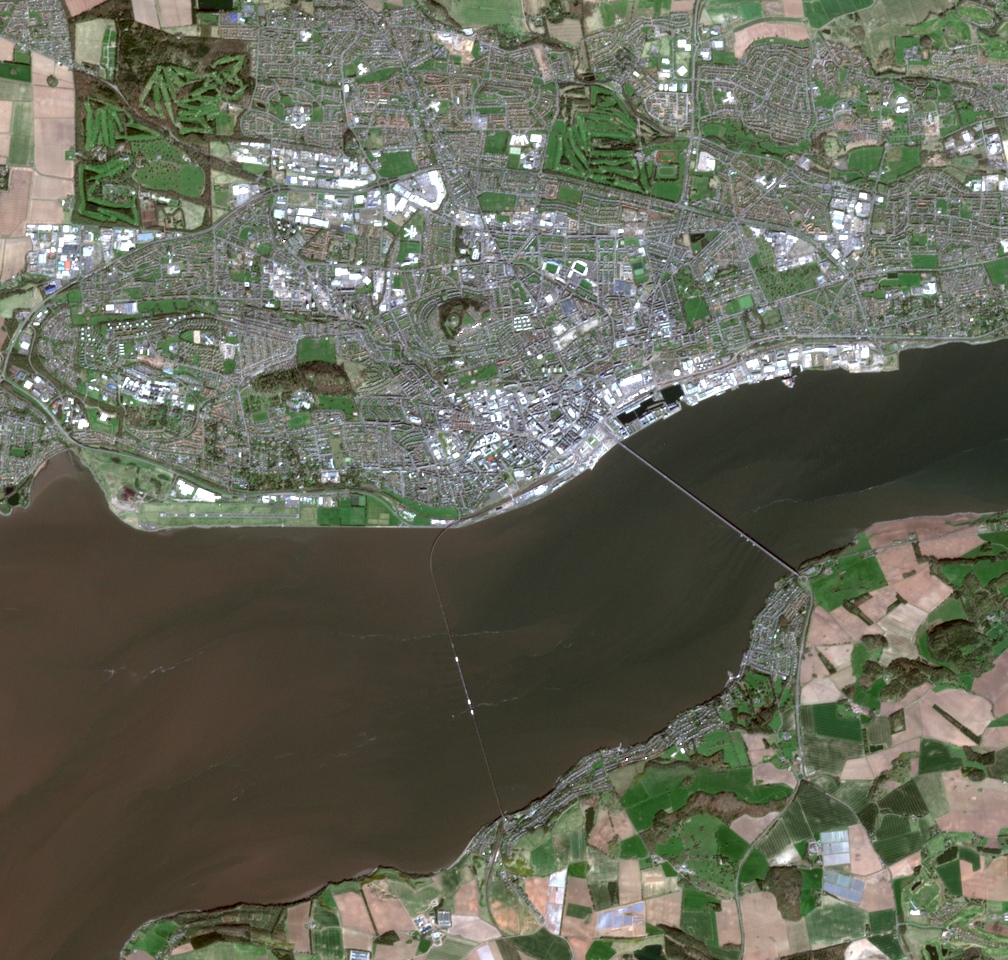
Dundee - rail & road bridges, RRS Discovery, the "Silvery Tay" & golf courses, too!
-thumbnail.jpg)
Majorca - 2016-Aug-26. A four-tile composite assembled by Les Hamilton using AutoPano
Pro. There is a "thumbnail" above, and you can get the full
image here (which is a 6 MB, 108 MP image (the original JPEG is 29 MB).
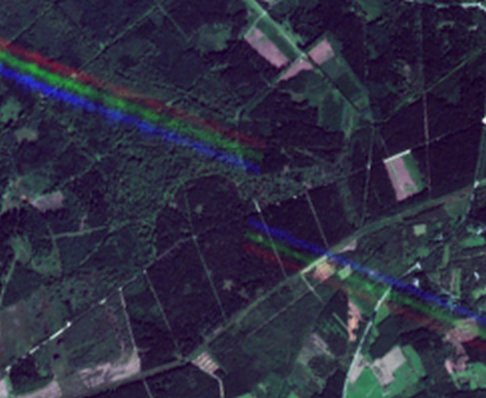
Strange results?
If you are seeing strange results - such as aircraft trails showing as
parallel red, green and blue lines - this page explains why:
https://pierre-markuse.net/2017/09/11/hurricane-jose-seen-sentinel-2-meets-eye/
@CoastalTEP
wrote in Twitter: "Each spectral band is acquired from a slightly different viewing angle. The image is processed so all bands overlap at ground level. For objects which are not on the surface like clouds and plane, there is a mismatch in the spectral bands."
Here is an exceptional example from Pierre's page:
Click for more information
| 


.reduced.jpg)