


![]()


|
|
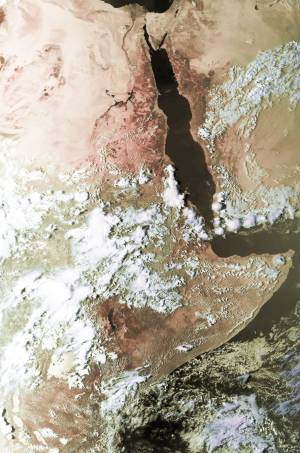
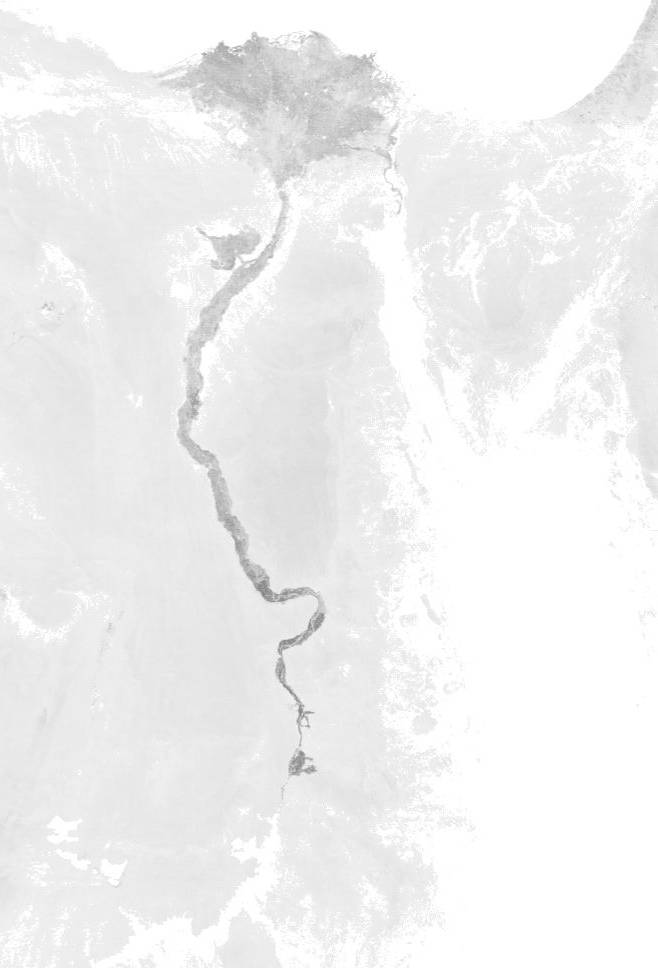
The HRPT Reader - Sample ResultsYou will find HRPT images on a variety of Web sites, including that of Michael Wienzek and Maurizio Bertolino. Here are some samples, part of a larger image, just to whet your appetite. These images were produced with the HRPT Reader available on this page. As an example of the sort of processing you can do, I have provided an example of vegetation extraction using a local area coverage (LAC) pass raw data from the NOAA CLASS facility formerly the Satellite Active Archive. It shows Egypt as a false-colour thumbnail, and a close-up. If you want to play with some raw data yourself, follow these instructions and get some data from NOAA's CLASS facility. The rest of this page may take a few moments to load as there are a number of large images.
Iceland
Even though the sun is very low in the sky in January, thus producing good shadow detail, the histogram equalisation capability of the HRPT Reader enables the maximum use to be made of the 10 bits of video data from the AVHRR scanner. Pass details: NOAA-16 2002 January 27 at 1313 UTC
2008 Total Solar Eclipse
The total solar eclipse on 2008 August 01 was captured on the extreme edge
of a Metop-A pass. I have processed the Metop-A data in my HRPT Reader program to bring out the
moon's shadow in the image, and
cropped and rotated the image by 90 degrees in Paint Shop Pro so that it is approximately north-up.
The moon's shadow can be seen at the lower-left of the image, and may look elongated because of
the very high latitude of the ground. I estimate the centre of the shadow to be at 66.5 E and 69.5N, which is in the
Yamal Peninsula, and timed
around 10:11:20 UTC.
Sarychev Peak eruption (Kuril Islands)Here are some images from 2009 June 16 showing an eruption of Sarychev Peak, which is in the Kuril Islands east of Japan. I've processed the data in three ways: a "classic" RGB:124 mapping (where the ash shows as purple and the clouds as yellow and land green, my own False-Colour algorithm which uses a visible channel for brightness and a thermal channel for colour, and a difference of the channel 4 and channel 5 (10.8Ķm and 11.8Ķm) brightness temperatures processed to show the volcanic ash. RGB:124 colour mapping "SatSignal" false-colour mapping Channel 4 - channel 5 BT difference highlighting volcanic ash
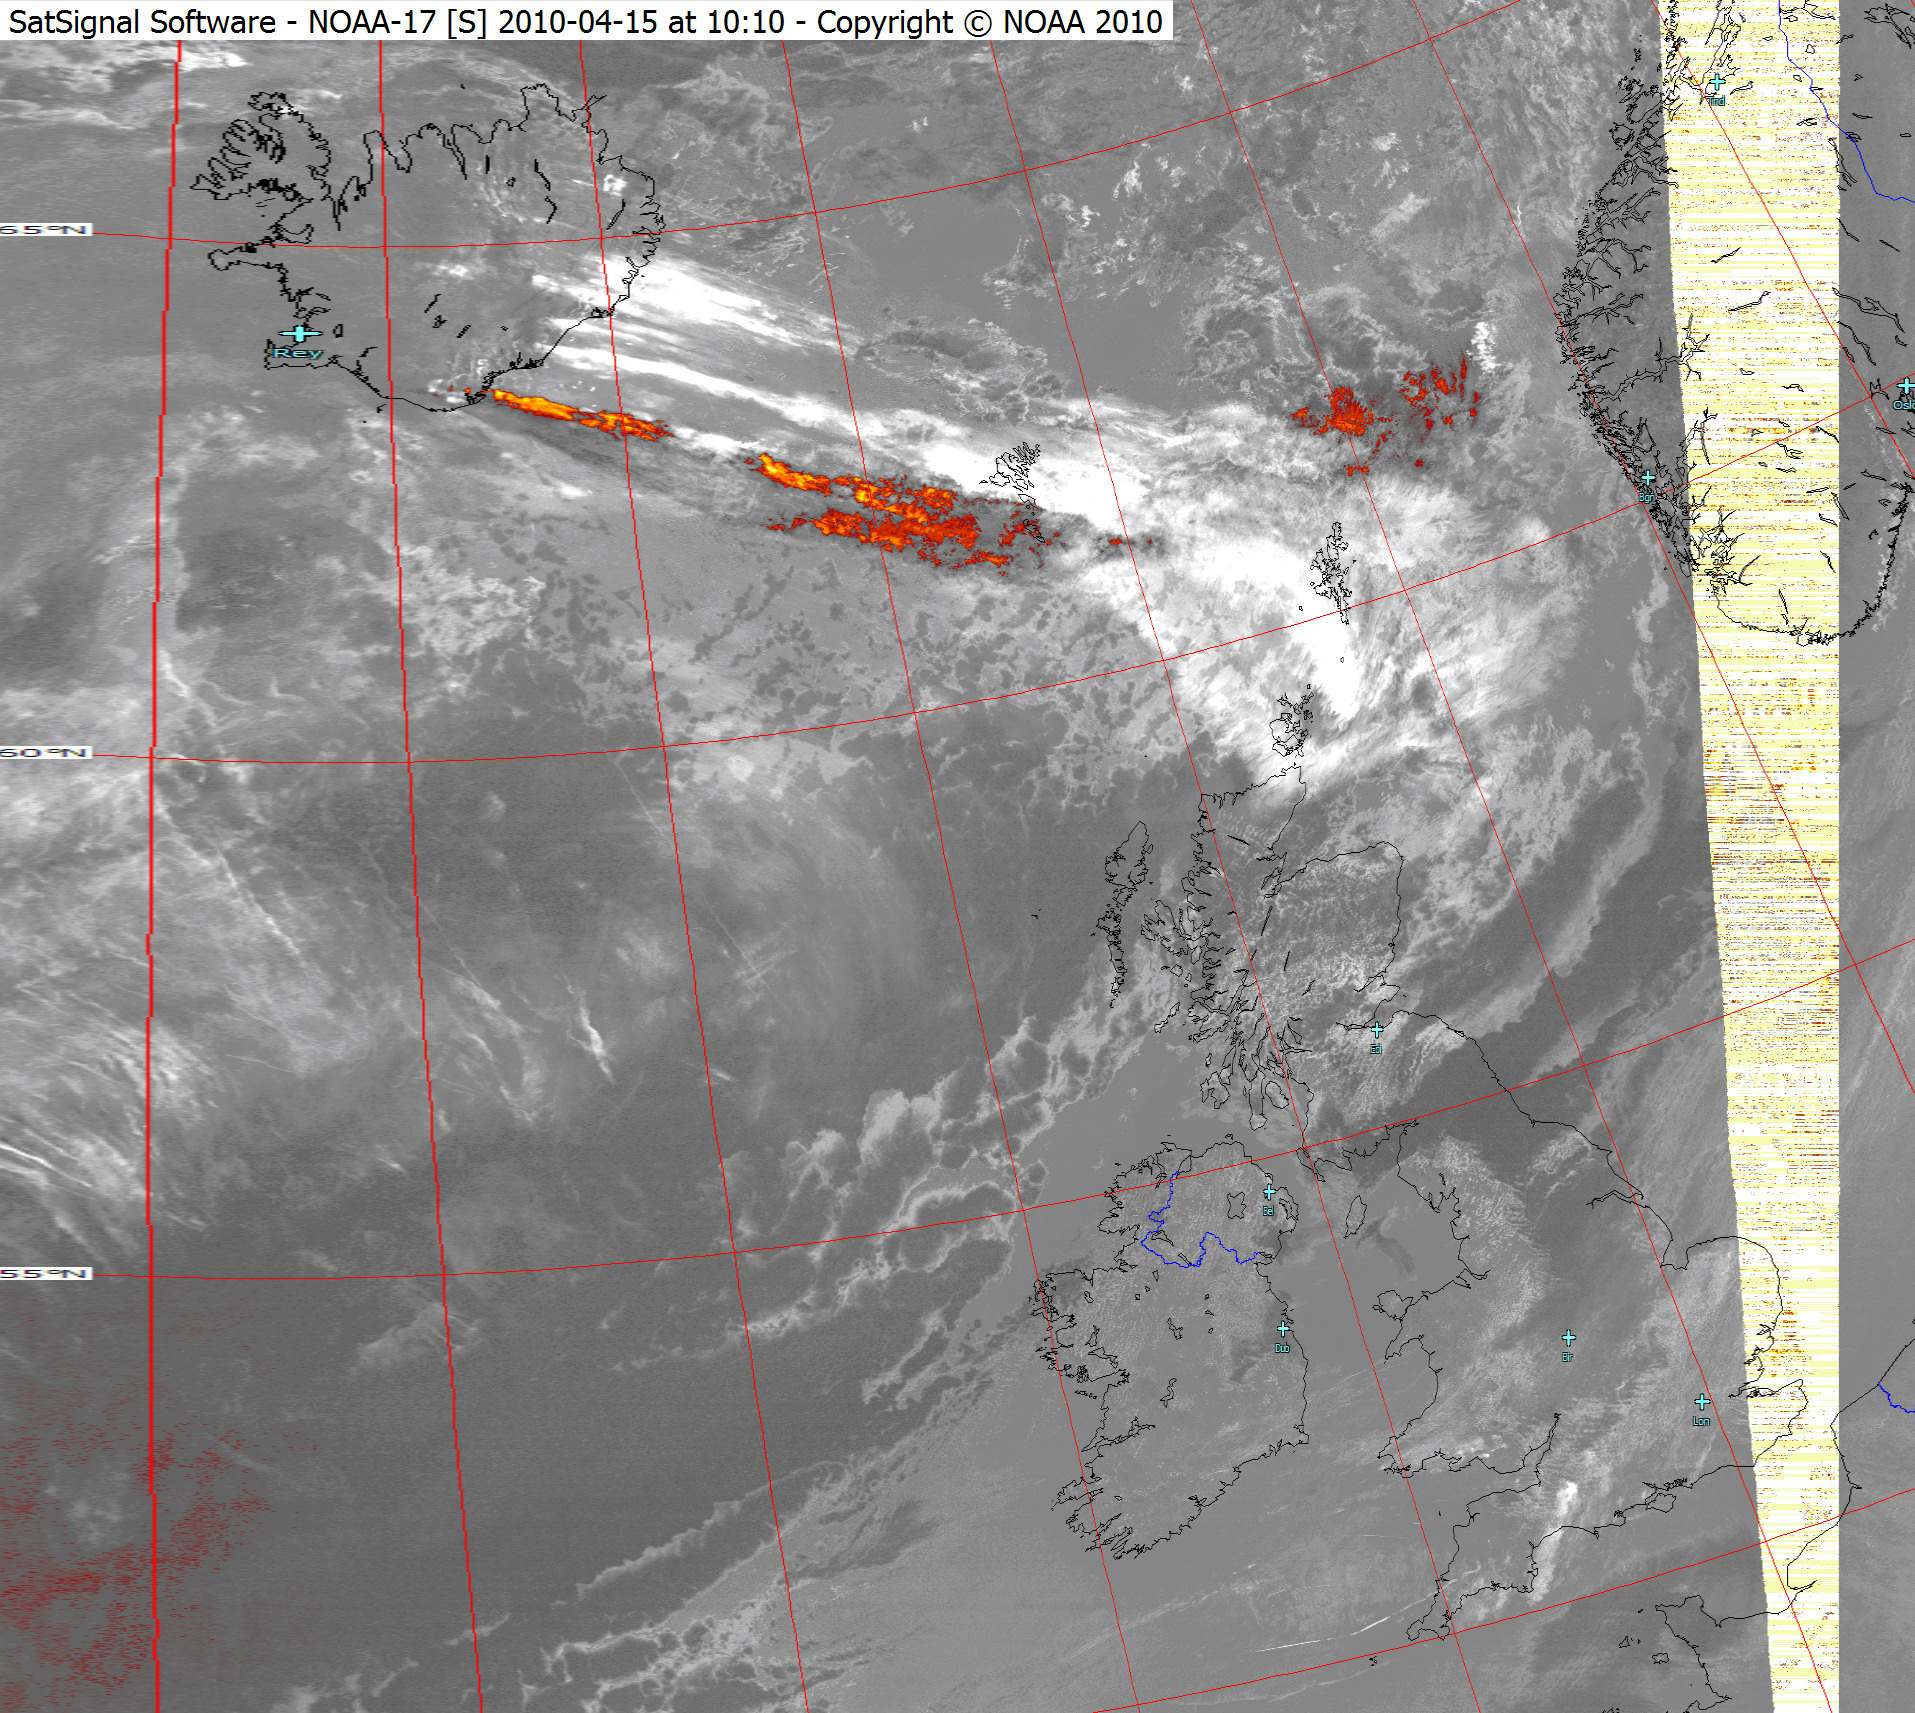
Metop data copyright (c) EUMETSAT 2009. Iceland volcano stops UK air traffic - 2010-Apr-15
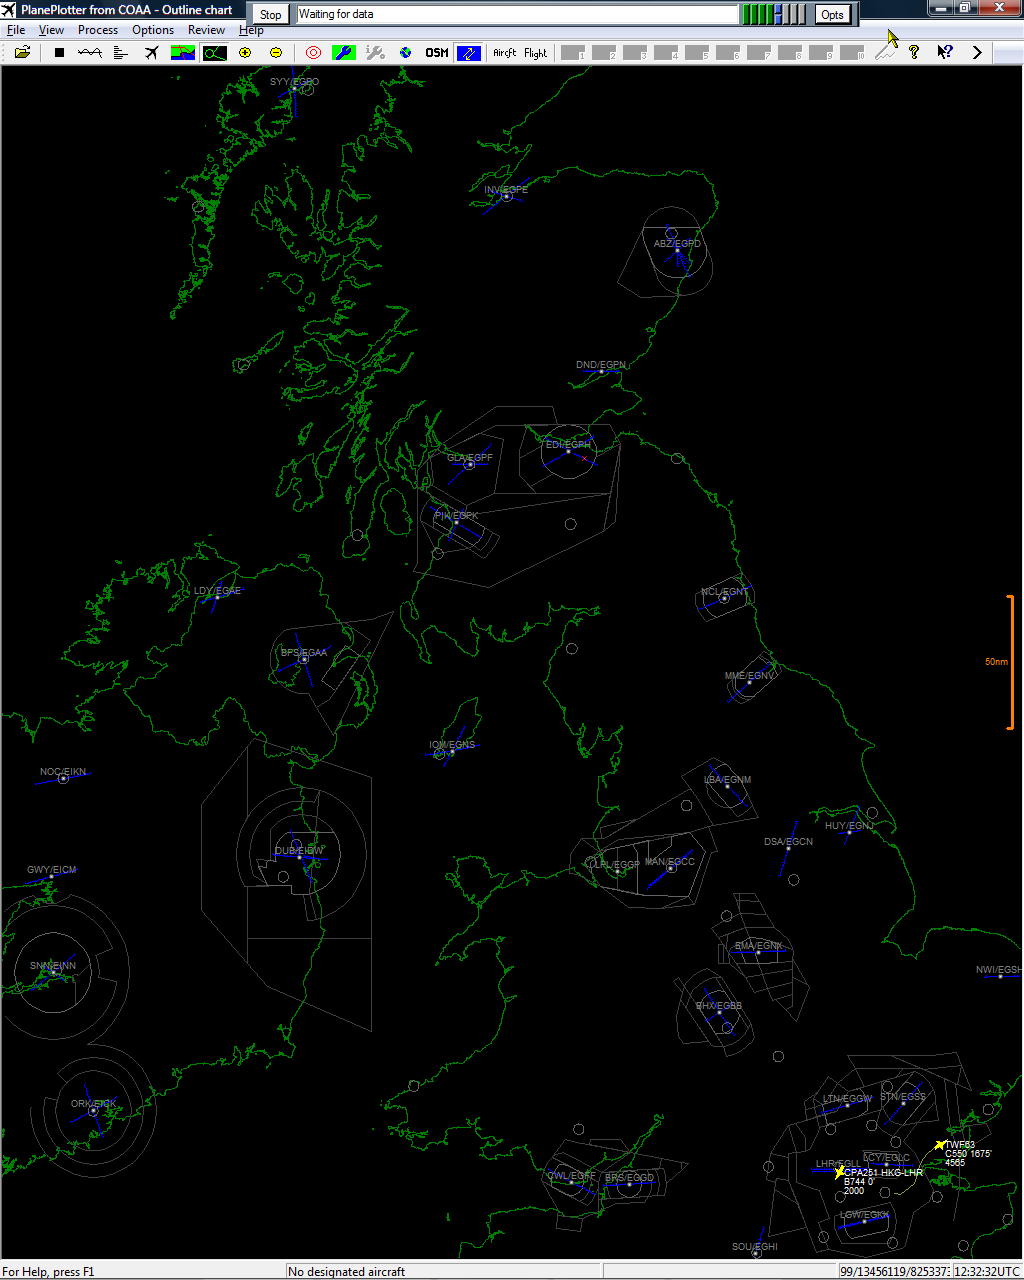
This is a false-colour image from NOAA-17, derived from differencing the two far-infra-red channels, with a colour palette applied to emphasise the volcanic ash/dust. The yellow band on the right-hand side of the image is caused by a satellite problem. Plane Plotter view around 12:30 UTC (13:30 local) - PlanePlotter is software you can download and buy here.
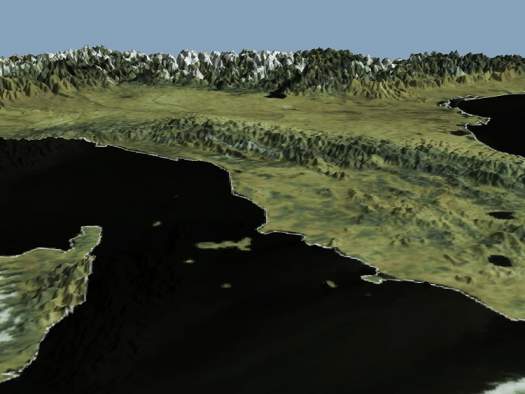
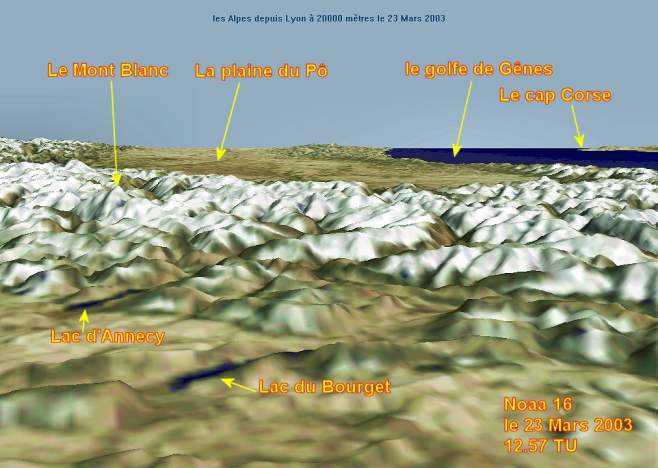
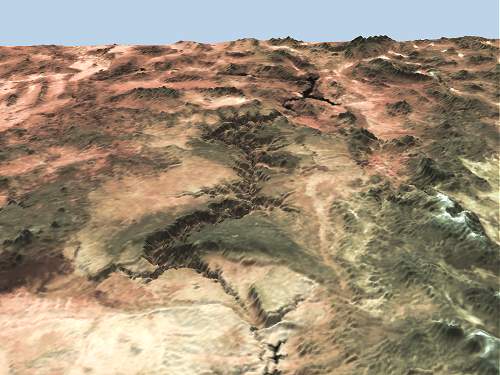
3D images and fly-pastsUsing my extra GroundMap program to geographically rectify the output from the HRPT reader, you can produce some stunning effects by using the 3DEM 3D Terrain Visualisation and Flyby Animation software with the image. Here are some results of this technique. The method was described in the RIG Journal 72 by Ed Murashie, to whom many thanks are due. You can even make an animation showing what it would be like flying over the terrain! There is an online tutorial available on Mike Long's Web site.
UK FloodsThe southern part of the UK was subject to heavy floods just at the start of 2003 which caused disruption over much of England, with the Midlands and East being particularly badly affected. The infra-red image below shows rivers swollen to an extent that I do not recall seeing before. The land is colder, and therefore lighter, than the water in the rivers and sea, so that the rivers show up as dark lines. This image is from NOAA-17 at 21:07 UTC on 2003-Jan-03.
Vegetation ExtractionHere raw data for a LAC pass for NOAA-14 has been downloaded and processed both with the standard false colour algorithm (using channel 2 for brightness and 4 for colour depending on temperature) and with the NDVI (normalised differential vegetation index) using channels 1 and 2, where the higher reflectivity of chlorophyll in the near infra-red is used to make a darker image. You can e-mail me for the 1MB full resolution copy of the overview by asking for file: 200010021338.N14-fc-corrected.jpg Pass details: NOAA-14 2000 October 02 at 1338 UTC
|
|
|


