


![]()


|
|
Metop LSA ViewerWhat is the Metop LSA Viewer?The Metop LSA Viewer is a program for use with the Metop data sent over EUMETCast from the EUMETSAT Land Surface Analysis, Satellite Application Facility (LSA-SAF) expert group.
What data will the Metop LSA Viewer read?At the beginning of April 2009, EUMETSAT introduced new LSA-SAF products from Metop on EUMETCast. The Land Surface Temperature (LST) and Down-welling Surface Long Wave Flux (DSLF) based on Metop are now disseminated in 3 minute strips covering the European region only. This provides data with a much higher resolution than can be achieved from geostationary satellites, albeit at the expense of fewer passes per day. EUMETCast requirements:Files for Europe will appear on the channel "SAF-Europe" (PID 500, multicast address 224.223.222.28). The filenames are pre-fixed with "S-LSA_-HDF5_LSASAF_EPS" with full details provided in the Product Manuals, see: http://landsaf.meteo.pt/ Sample file names: My MSG Data Manger software has been updated to handle this new LSA data, and you can get a beta version including the update here.
How do I install and use the Metop LSA Viewer?Installing the viewerCopy the files from the Zip archive to a folder of your choice, such as: C:\Tools\SatSignal\MetopLSA\ Windows Vista users are advised to avoid using the C:\Program Files\ folder. Using the viewerRun the program by double-clicking, and drag-and-drop a Metop LST or DSLF file from Windows Explorer onto the program. You can drag and drop a file onto the program's icon as well, or use the File|Open menu. The program will combine data from adjacent three-minute segments to produce a composite "pass" of information. The individual segments are shown on the Pass overview tab. The program automatically creates a suitable mapping region to display the data at high resolution, and you can switch to the LST or DSLF tabs to see this data. You can investigate particular regions by moving the mouse cursor over those regions, when the location and temperature or flux details will be displayed in the program's status bar. You can use the Setup tab to control the how the colour lookup works, i.e. what the minimum and maximum temperatures are set to, and what the maximum of the DSLF colour scale should be. This is a program in the early stages of development, and I welcome you input as to further developments.
Can I register and what do I get?The program includes a 30-day trial licence period to allow you to evaluate its function. After the 30-day period, you will need to register to continue running the program. Registration also entitles you to technical support. Register the Metop LSA Viewer here.
Download the Metop LSA Viewer
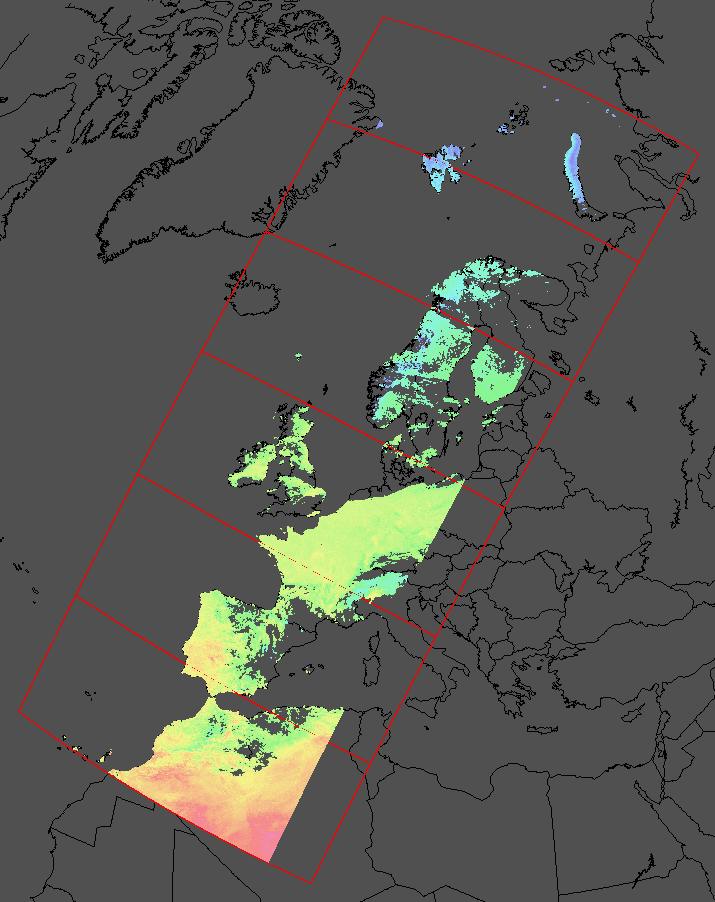
Screenshots of the Metop LSA Viewer in operationThe program will assemble the 3-minute segments into a "composite pass". Here is the Pass Overview tab, which shows the six segments comprising a particular pass, with the land temperature data used to colour the active portions of the data. Note that where the land is obscured by cloud, no temperatures are available.
|
|
|