|
| |
There are a small number of map and image making tools that I offer on
this page. The first is a tool which allows you to remap images as
backgrounds for geostationary weather satellite data, the second is related to my WXtrack program, and allows you to make a
customised master overlay, and the third is a set of programs for using some public data
sources. I conclude with a note on data sources.
MapToGeo - for GeoSatSignal
MapToGeo allows you to take images in Plate-Carreé projection
(azimuthal equidistant - linear latitude and longitude) and convert them into
the view as seen by the current geostationary weather satellites around the
world. This allows you to use the images as attractive backgrounds for GeoSatSignal,
combining an idealised daylight image with the current cloud patterns, as an aid
to weather presentation. This technique was suggested by Ferdinand
Valk. The great thing is that images like the one below can be
generated day or night - there is no need to have a daylight image for
the region. This greatly extends the ability of GeoSatSignal to produce
easily understood data right round the clock.
What the users say:
- "Finally a tool that allows me to bring a uniform view to
presentations of world wide weather, irrespective the Geostationary satellite used and time of day.
Simple, functional and easy to use." - Ferdinand Valk, Earth at Large.
 Download MapToGeo
 Register
MapToGeo Register
MapToGeo
Here are some sample results from GeoSatSignal using a
background (from Blue
Marble)
converted with MapToGeo. Many thanks to Ferdinand Valk for providing these
sample images. He can be contacted for large format images like these
with a superb print quality, and you can see Ferdinand's
own comments about the program here.
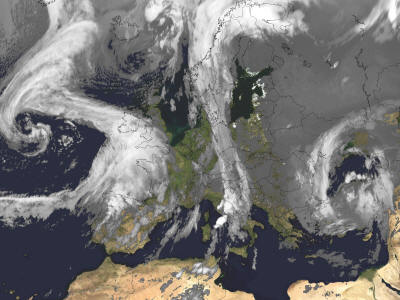
Cloud data from the Meteosat-8 weather satellite overlaid
on a remapped background from a Blue Marble image. This data was
from the 1800 UTC scan when much of Europe was in night time, yet the image
looks like a daylight one!
(Processed by Ferdinand Valk) |
|
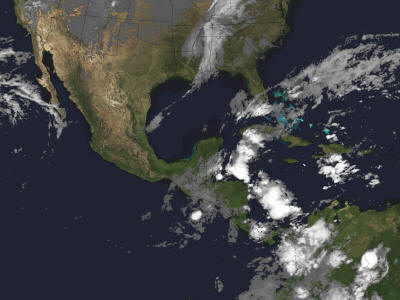
Cloud data from the GOES-12 weather satellite overlaid on a
remapped background from a Blue Marble image. The palette used can
be tuned for best match to the weather expected in a particular season.
(Processed by Ferdinand Valk) |
Image sizes
You may find images of various sizes on the Web. There
are limits to the size of images that MapToGeo can handle directly, but images
up to 5400 pixels wide (east-west) and 2700 pixels high (north-south) should
work in the program without problems. For generating the larger output
formats, you will probably want to have at least 1 GB of memory in your
PC.
To alleviate the image size problem, V1.0.2 of MapToGeo
provides the option to use an input image which is only a fraction of the full
Plate-Carreé projection, and combine the resulting output geostationary
projection images in your favourite image editor (e.g. by arithmetic and taking
the lighter image, or by using layers). There are three options for input
image size:
- Full-size image, up to say 5400 x 2700 pixels, 15 pixels
per degree.
- Two half-size images, one for the western hemisphere
(-180° to 0° longitude) and one for the eastern hemisphere (0° to +180°
longitude). Each image should be square, and sizes of up to 10800 x
10800 pixels per image have been tested (60 pixels per degree).
- Four quadrants - western hemisphere north, western
hemisphere south, eastern hemisphere north, eastern hemisphere south) each
with a 2:1 aspect ratio. Images with a size of 10800 longitude and
5400 pixels latitude (60 pixels per degree) have been tested. These
are referred to like the GMS-5/MTSAT-1R weather satellite quadrants:
- A is north-west
- B is north east
- C is south-west
- D is south east
The quoted sizes are not maxima, and you may be able to go a
little larger, but perhaps not twice as large.
| V2.0.2 |
Add 9.5° East HRV segment (Europe &
wide), add GOMS-1 support, hide obsolete mappings - but add option to show
them if required (File|Options menu), accept PNG for input and allow for
batch mode output, program will try to use 3 GB memory if needed (but
doesn't support Windows Vista), command-line mode for remapping Meteosat
full-scan data to rapid-scan segment. |
| V2.0.4 |
Add Himawari-8 segment, add 41.5° East MSG
IODC segments (full disk channels 1-12).
If you don't already have a MapToGeo 2 key, contact me for a fresh
licence key before using this software. |
Beta version: This program is under continual
development - check here
for the latest update.
This program will allow you to create a customised master bitmap image
for using overlays with WXtrack and SatSignal. You can customise the grid-line spacing,
whether a numerical annotation is displayed and its font, and whether or not the
grid-lines should overlay countries. You should already have a working version of WXtrack,
and the countries.dat file installed.
Download MakeOverlay V1.4.0, 34436
bytes, revised 2002 Apr 04
If you do not already have the file countries.dat, you can download countries.zip here. You will need to
unzip the countries.zip archive and extract the countries.dat file to
appropriate location. Note that more recent versions
of countries.dat include a few extra islands. If these appear to be missing from
your version, check that you only have a recent copy, and not an old version in another
folder. V1.4.0
allow the suppression of both grid lines and country boundaries.
Note that you will require a graphics driver that can handle more than the full resolution
of the screen. This is usually true with Windows NT drivers, but may not be true
with some Windows 9X graphics drivers.
LonLat2dat - updating Countries.dat
Download LonLat2dat.zip
This small package contains a program to convert MapGen format
(perhaps downloaded from the NGDC
Coastlines Extractor) data into a format you can append to the Countries.dat
file. Please note that this package is not supported by me, but self-help
is available in the SatSignal
self-help group. There are full instructions about updating Countries.dat
in the Zip download.
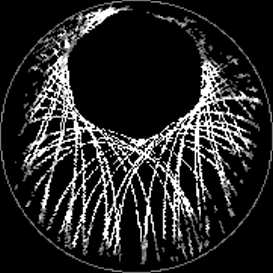
Unsupported program which uses the signal strengths of GPS
satellites (as reported by your GPS receiver) to determine your radio
horizon. One side result is a polar plot of GPS satellite coverage,
showing the hole in the coverage at the pole (as the satellites don't orbit that
far north).
Writing to the timekeepers mailing list, Jan Hoevers
explains: GPS satellites are not geostationary.
The instructions that came with your receiver recommend "clear view of the sky".
Unless you live in the middle of a desert a clear view of the
entire sky will be impossible. Luckily you won't need that, because - no matter where on earth you live - a large part of the sky will never show
any GPS satellites. You can make clever use of this when you have to position the antenna in a suboptimal position, e.g. on a window.
The orbital plane of any GPS satellite has an angle of 55 degrees with the equatorial plane, taking the satellite up and down between 55 deg
north and 55 deg south. The satellite constellation populates a band - more or less donut shaped - around the earth,
centred around the equatorial plane. No GPS satellite ever flies over the poles (some other
satellites do).
Seen from the earth's surface that leaves a large circular area of the sky - cantered
over the pole - where no satellites fly. In tropical and temperate zones part of that circle is below the horizon, at latitudes
of more than 55 deg the entire circle is above the horizon, and a (small) part of the "opposite side of the donut" becomes visible at the
northern horizon (southern horizon if you're down under).
Close to the poles the satellites will appear to remain close to the horizon, with the unpopulated circle overhead, while near the equator two
unpopulated circles are visible, north and south, making the satellites appear in a band from east to west.
Myself I live at a latitude of 52 deg north, meaning the northern sky is not interesting (except for a small band of 3 deg through the
zenith). Consequently I have my receiver glued to the outside of a south looking window. A position on the roof would be possible, but I won't go
through the trouble, because no improvement can be expected.
Try to imagine where the satellites fly as seen from your position, it will help in finding the best position for your
GPS antenna!
Other Mapping Tools
A few people have asked about the data and programs used to create the
hill-shaded topographic map. Data came from GTOPO30 for topography, and GSHHS for
shoreline and lake data, and I wrote my own programs to manipulate this data. You
can download a 197 kB package containing pointers to the
data, and the Delphi 5 source code that I used if you wish. This is really just for
your interest, and is informal and not subject to any version control. Last updated,
2002 Mar 17. You will likely need a few other units if you want to recompile the
programs, but they would be easy to modify to suit your own purposes. Please contact
me if you have any notes or programs you might wish to add to this package.
Download the Mapping Tools package
Programs in the package
All these programs come with Borland's Delphi 5 source code ready for
you to compile and use. You may need some of my other units from my Components
page.
- GSHHS reader - simple test program to read GSHHS data.
- GTOPO30 to Height Image - program to subsample heights into an image for
storage. Uses GSHHS lake data to add lakes and inland seas to the GTOPO30 data.
- Shade Height Image - program to covert a stored height image to colour,
derive a shading function from the rate of change of height, and make a combined
hill-shaded image.
- ETOPO5 - program to demonstrate reading the
lower-resolution ETOPO5 5 minute elevation data and the COUNTRIES.dat
country and state boundary data. This program can now also read the
2-minute data TOPO_8.2.img.
Data Sources
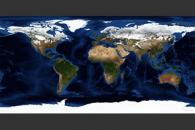
Blue
Marble comprises a set of clear-sky earth images at various
resolutions. Can be used with my MapToGeo program.
NASA's Earth
Observatory writes: "Everyone knows that NASA studies space; fewer
people know that NASA also studies Earth. Since the agency’s creation almost
50 years ago, NASA has been a world leader in space-based studies of our home
planet. Our mission has always been to explore, to discover, and to understand
the world in which we live from the unique vantage point of space, and to share
our newly gained perspectives with the public. That spirit of sharing remains
true today as NASA operates 18 of the most advanced Earth-observing satellites
ever built, helping scientists make some of the most detailed observations ever
made of our world.
"In celebration of the deployment of its Earth Observing System, NASA is
pleased to share the newest in its series of stunning Earth images,
affectionately named the “Blue Marble.” This new Earth imagery enhances the
Blue Marble legacy by providing a detailed look at an entire year in the life of
our planet. In sharing these Blue Marble images, NASA hopes the public will join
with the agency in its continuing exploration of our world from the unique
perspective of space."
The monthly global images may be found here
- click on the image below to get a page of downloads!
U.S. Department of Commerce, National Oceanic and Atmospheric
Administration, National Geophysical Data Center, 2006. 2-minute Gridded
Global Relief Data (ETOPO2v2). This data is approximately 2km
resolution at the equator, and has 1 metre height resolution.
The compressed raw data is about 72MB, and can be downloaded
in both big-endian and little-endian versions.
| Les Hamilton kindly provided
this example of using ETOPO2 data. The image has been JPEG
compressed for reduced download time and storage space, and the original
has much better quality. |
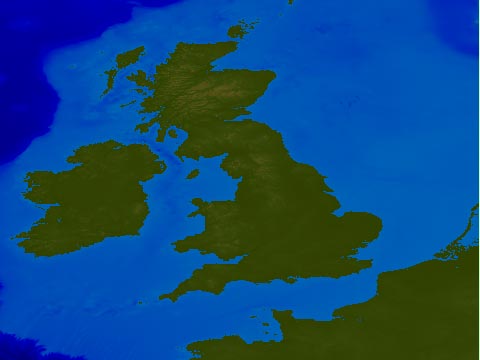 |
Les Hamilton
has also kindly provided a Delphi program to create maps like that above from the
ETOPO2 data file. You can download an installation package here: http://leshamilton.co.uk/etopo2.htm.
Les is willing to make the Pascal/Delphi source code available, and if you are interested,
you can make your request to Les here: lesw (dot) hamilton (at) tiscali.co.uk.
Digital heights of the world and sea floor level. This
is a single file of data at 5 minute intervals, making 360 x 12 points in
longitude, and 180 x 12 points in latitude. Note that the file formats are
slightly different, Jones having one extra 16-bit word per line of data
(longitude), and being in PC order (little-endian, or low byte first).
Les Hamilton writes: "For VB5/6 programmers interested in learning how to make use of the ETOPO5
elevation data, I have developed this small Visual Basic program. You are free to download and modify it to suit your own map creation
purposes. All source code is included".
There is a two-minute resolution version of this file which
has Mercator projection covering most of the world at the URL below. It is
about 136 MB uncompressed.
Digital heights of the world - at 30 second intervals. This
data is divided into 33 tiles - about 50 MB each, but a lot less when compressed with
Zip. You should be aware that the topography data occupies some 1.74 GB when
expanded, but it is available at cost from the US source on CDs. Sources:
GSHHS is shoreline and lake data that comes at a variety of
resolutions. You will probably find the low resolution data (5Km, 1.1MB) adequate,
there are also intermediate resolution (1 km, 5 MB) and high resolution data
(0.2 km)
available. Its main use here is in adding lakes to the height data, which otherwise
only has major seas.
If you need to resample to a different accuracy (I find about
2.2 km about right for HRPT data), there is a C program provided in the GSHHS
archive which uses the Douglas-Peucker algorithm. Just in case you don't
have a C compiler to hand, I have provided a ready-compiled
version. Updated 2006 April 20 for the V1.3 GSHHS data - ready-compiled
software V1.5 for V1.3 data.
I use the raw GSHHS data myself, although the authors offer a very fine map
generation package called Generic Mapping Tools (GMT) which has a compiled version of the
data.
Here you can get some land-sea mask data. Please see
here for a full description: http://oceancolor.gsfc.nasa.gov/DOCS/ODPS_Land_Mask.pdf.
I've provided a local download which is zipped to save you time
and bandwidth.
|