|
| | Using GeoSatSignal
Douglas Deans' articles on geostationary weather satellites.
These articles are written by the long-time geostationary
weather satellite expert, Douglas Deans, and may help put the usage of
GeoSatSignal into perspective. They were written before and during the
initial trials of the Meteosat Second Generation satellite (MSG-1), now
Meteosat-8.
Getting the data
GeoSatSignal can utilise data from a variety of sources,
Internet data, WEFAX images, and digital HRI data in a variety of formats such
as from the Rob Alblas decoder, Dundee PDUS data and Timestep MPD files.
If you want to use Internet data, I have a simple program that will help
registered users of GeoSatSignal retrieve data automatically. More
information on AutoGet.
Where do I get data files?
The best way is to get your own data from the satellite.
In Europe, there is the EUMETCast rebroadcast system which will provide data
from both Meteosat-8 and many other geostationary satellites around the
world. If you don't have hardware for receiving images directly, you
will want to get data from the Internet. There are many Internet data
sources, but here are some I can recommend:
- Meteosat 5 and Meteosat 7
- Coverage of Europe and Africa if provided by the
Meteosat 7 satellite which is in geostationary orbit above 0 degrees
longitude. Coverage of the Indian Ocean is provided by Meteosat 5
at 63 degrees east. These satellites are sometimes abbreviated to
Met 7 and Met 5, and the Indian Ocean Data Coverage is sometimes called
IODC.
- You can download files for Meteosat (including some
relays of foreign satellite data) from the University
of Ulm.
- If you want a different view of Europe, the University
of Dundee offer image
downloads free of charge or registration. You may also want to
register at this
site because they also offer NOAA quick look images (from HRPT data)
and may allow you to access the digital PDUS data if you ask
nicely! However, some of these images are restricted to 6 hourly
intervals. Again, these images include relayed GOES-W, GOES-E,
Indian Ocean and MTSAT-1R ( GMS) data. Be sure to use the "Full"
resolution images for best results.
- Meteosat-6
- Digital and image data from Meteosat-6 can be obtained
from EUMETSAT from their Rapid
Scanning Service (RSS). Data from 24 hours ago is free of
charge, but you might have to pay for the current data if you intend to
use it commercially. Amateur users can get an HRI licence free of
charge and access the current data.
- GOES-E and GOES-W
- These are generic names for the satellites covering the
East coast and West coast of the Americas. GOES-E is located at
longitude 75 degrees West, and GOES-W at 135 degrees West.
- There is a rolling archive of data available from the
Goddard Space Flight Center (GSFC) for both GOES-E and GOES-W split down
into a variety of views and into various sensor channels. For
example, here is a directory
of the recent GOES-E thermal data. The top of the GOES-E
tree and the GOES-W
tree are also accessible. These TIFF files are quite large (at
up to 1.1MB each) and you may prefer to convert them into PNG files for
use by GeoSatSignal. The free IrfanView
can do this in batch mode.
- The GSFC also offers image downloads of various
satellites from its FTP server, which can be accessed at: ftp://rsd.gsfc.nasa.gov/pub/Weather/
but note that the generic GOES-E is replaced by the specific GOES-12 and
GOES-W becomes GOES-10.
- MTSAT-1R (formerly GMS-5 and GOES-9)
- This satellite covers Japan, China, Australia and New
Zealand. It is located at longitude 140 degrees east.
- Image files can be downloaded from the GSFC
site via FTP.
Storing the data
You may find it helpful to adopt a convention for storing data
so that you can easily go back to a certain date, and so that you can easily
archive a single period on a CD. As you have the ability to gather a lot
of data, choose a disk with plenty of free space! In my case, I use the
year\month\day naming convention understood both by AutoGet and GeoSatSignal,
and therefore my Dundee image files for St. Valentine's Day 2002 could be stored
in:
D:\GeoSat\Dundee\images\2002\02\14
As most of the file names are unambiguous, there's really
nothing to stop you keeping all your different data sources in the same folder
structure, although I choose not to do that. The advantage of using this
convention is that you don't need to specify exact file names to the program, so
that you could have a daily scheduled batch file running the following command
to animate Meteosat thermal D1/D2/D3 joined images from Nottingham:
GeoSatSignal.exe D:\GeoSat\Notts\d2*.jpg -j9 -anim:D:\GeoSat\Anim\Daily.avi -close
but we are getting a little ahead of ourselves here....
Loading data into GeoSatSignal
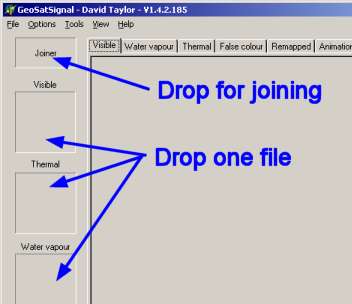
| Of course, GeoSatSignal has the normal File, Open commands but
in addition you can drag-and-drop files from Explorer or other programs on to
GeoSatSignal. Depending whether you wish to join images together, there
are two different areas where you can drop files. You will see the mouse
cursor symbol change when it is over an area that accepts a file drop. |
 |
Because GeoSatSignal makes a false-colour image from the
thermal and visible band images if both are available, if you load a
visible-band image, the program will try and find a matching thermal image so
that a false-colour image will be produced (you can disable this if you
wish). However, if you only give it a thermal image, it will not
try and seek out a visible image. GeoSatSignal knows about the naming
conventions used by the various sites to make this happen automatically.
Joining images - WEFAX only
| If you use segmented data, you will want to
try joining it together to make a bigger image. There are a whole
lot of joins built into GeoSatSignal, in particular joining Meteosat 7's
D1 D2 and D3 segments into a view of Europe, joining GOES NE and NW
sectors, and all four MTSAT-1R ( GMS) sectors. You need do nothing to enable
these joins - simply ensure that your files follow the naming conventions
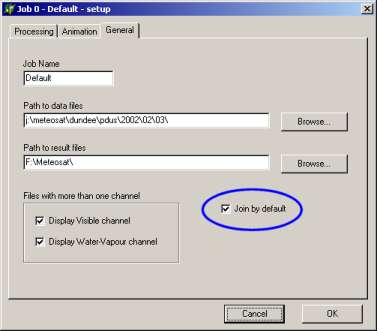
given in the Help file. You can control whether the program tries to
join files when invoked from the command-line in the job-specific setup
tab. |
 |
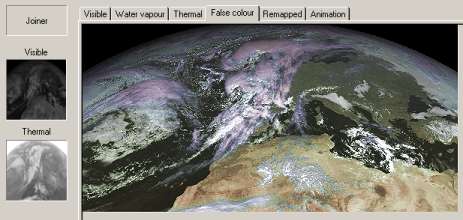
Combining images
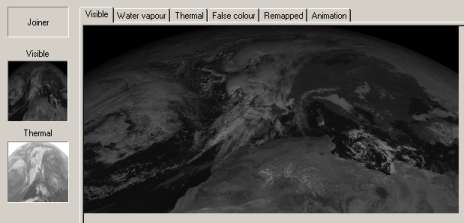
Having loaded an image, in this case a visible image,
GeoSatSignal will automatically try and find a matching infra-red or thermal
channel image (you can turn this off, if you want). You will be able to
see thumbnails of the images that have been loaded in the panels on the
left-hand side on the main screen, together with the primary images in the
tabbed control. Here we can see the visible channel image. Because
it has not been processed, the image looks quite dark.
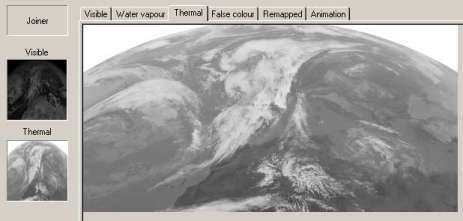
Clicking on the Thermal tab will show the image loaded for
that channel.
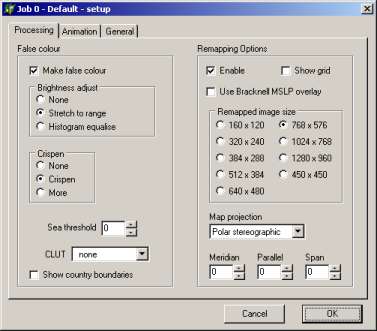
Processing options
| As with SatSignal, GeoSatSignal has a
variety of processing options. These allow you to control how the
visible channel is processed (stretched to the full range of the input
signal or histogram equalised), whether it is made crisper, whether a sea
background is added etc. |
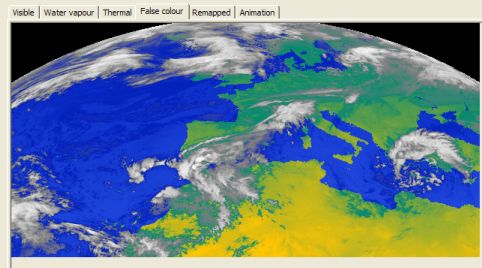
 |
The resulting false-colour image combines the
brightness from the visible channel and the colour from the thermal channel,
resulting in a pleasing image that also carries temperature information.
Using the land/sea mask option, you can get an
image like this one (taken from a different day).
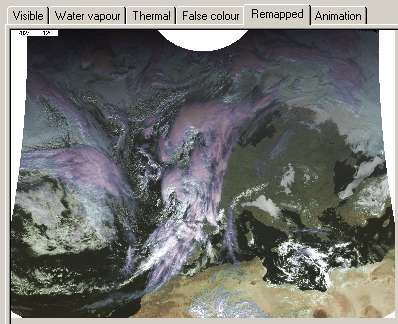
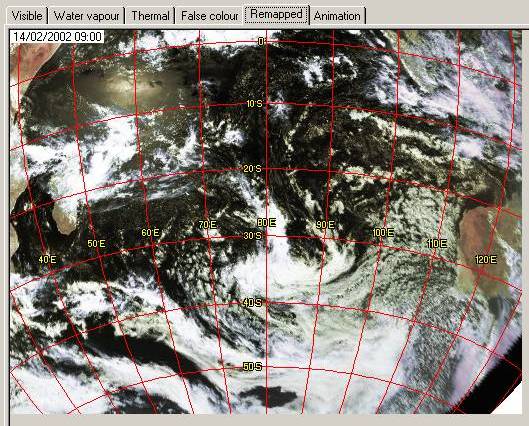
Remapping
| Something that is easier with geostationary
satellites is mapping the image to a standard map projection such as
polar-stereographic or orthographic. Clicking on the Remapped tab
should reveal such an image.
As you can see from the Options dialog above, there are
many choices about the scaling and presentation of this image. |
 |
Animation
As well as being able to save the images you see, by ensuring
your files conform to one of the many naming standards supported by
GeoSatSignal, you can animate any of the images you see on the screen. By
choosing the appropriate data source, frames can be as little as ten minutes
apart, producing a remarkably smooth animation. Equally, standard Internet
data sources allow 30-minute intervals. The registered version of
GeoSatSignal also allows smoother animation by adding additional interpolated
frames. Animation output is in standard AVI format, which can easily be
converted to MPEG or other formats for more compact storage.
Map Projections
You can alter the map projection used in GeoSatSignal, and
locate the map to a region of your choice. Suppose you wanted to produce
an image from the Indian Ocean satellite (Meteosat 5) which covered from Africa
to Australia, like the one shown below. What settings do you need to use?
- As we want to map a region around equatorial
latitudes, the Orthographic rather than the Polar Stereographic is a
more appropriate projection. Choose orthographic from the
drop-down list.
- Next, you should choose the location of the centre of
your new mapping. Here, we have chosen a meridian (east - west)
of +80, i.e. 80 degrees east. We want the centre of the map to
be at 28 degrees south, so choose the Parallel as -28.
- Finally, to get the desired coverage, set the Span of
the mapping. Here we want a quite wide coverage, so the maximum
value of 75 degrees has been chosen.
- Click the OK button to reprocess the image.
|
 |
You can download
GeoSatSignal from this page.
Back to Satellite
Software |