|
| |
AVHRR Manager
The AVHRR Manager is a program to
assist with the reception and management of NOAA-19 and Metop-A/B/C AVHRR data being sent over EUMETCast
as part of the EUMETSAT EARS AVHRR service. Here
is a Google Earth KMZ file showing the locations of the EUMETSAT ground
stations (updates welcomed!).
User comments
- "Thanks for all your great programs, they are a joy to use and your new program
AVHRR Manager!!" - Donald Martin
- "Many thanks yet again for having another program up and running for launch day
--- superb service completely unrivalled" - Ian Deans
- "Congratulations on the successful start of you new AVHRR
Manager. Great software as always!" - Maik Dobbermann, Laboratory for Climatology and Remote Sensing,
Philipps-University of Marburg
- "My registration has just arrived for upgrade to MSG Data
Manager and also AVHRR manager. I must admit I'm blown away by it and
have just sat down again after dancing around the room! What have I
been missing ah? Awesome." - Rob Denton
Functions
The AVHRR Manager combines a number of functions:
- De-compression of the NOAA-17, NOAA-19 & Metop-A/B/C data
- Re-assembly of the segmented data into composite AVHRR files
- Handling out-of-order data and long or short segments
- Provides optional audible warning of new pass and new
segment
- Provides attractive quick-look Map View display of current pass
- Provides an overlay of the location of the EUMETSAT
HRPT receiving stations
- Provides a view of the latest segment processed
- Provides a browser for both image thumbnails and AVHRR data,
with quick access to processing software
- Provides a log of events, saved to disk and automatically
size-limited
- Provides a list of passes for each of the receiving
stations
Displaying the data
The AVHRR Manager is but one component of an HRPT software
set, and how you expand it is up you and your particular needs.
- The composite output produced by the program is in a
standard format, allowing viewing by software like my HRPT
Reader. The HRPT Reader allows you to view different combinations
of the five data channels, and provides both attractive images and
scientifically useful data. The temperature display is calibrated, and
multiple country-boundary overlays can be added. There is a free
version of the HRPT Reader, as well as a registered version which supports
more functions and allows fully automated operation from the
command-line. The HRPT Reader can share its Kepler data with the AVHRR
Manager.
- Should you wish to to reproject the output from the HRPT
Reader into standard map projections, so that it can be combined with other
data sources in a Geographical Information System (GIS), you can use my Ground
Map program. By using a common map projection, data from many
sources can be brought together, providing a much more complete picture of
the prevailing atmospheric conditions.
- Current Kepler data is required by the AVHRR Manager, and
you can get that data easily. My WXtrack program
provides an easy way for you to retrieve Kepler data and gives a very
attractive display of the locations of multiple satellites including the
ISS. However, for displaying passes more than a week or two old, you
need Kepler data which is contemporary with the pass, and therefore you need
historical Kepler data. The registered version of my WXtrack program
allows the use of the registered version of my Kepler
Manager software, which allows fully-automated management of Kepler
data, downloading it from the Space-Track Web site, and updating a local
copy of the multi-entry historical Kepler data required by both the HRPT
Reader and the AVHRR Manager.
As you may wish to purchase more than just the AVHRR Manager,
I do also offer a package of the five programs mentioned above called the HRPT
Toolset suite, providing you a substantial discount. There is also HRPT
Toolset Plus suite which includes the Metop
Manager for EPS data as well.
Screen-shot when running the AVHRR Manager
with NOAA-17 data from 2006 August 23. This shows a composite pass from combining
three stations, one being south (Maspalomas in the Canary Islands), one in
northern France (Lannion), and the other
being north (Svalbard). The location of the active stations is shown
by antenna symbols. New stations in Greenland and Athens have since been added to the network.
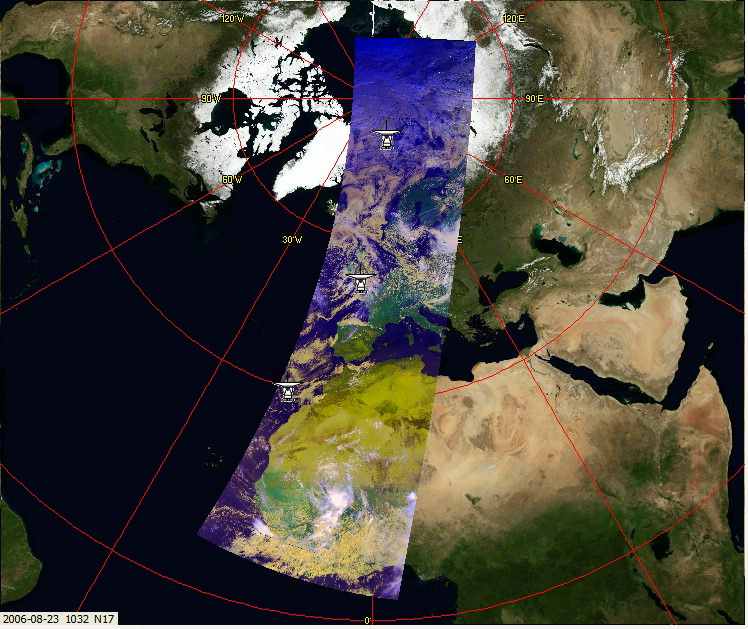
The full output from the program is a
strip of width 2048 pixels and (in this case) 10080 pixels high. When
processed, the output image is typically 2600 pixels wide, with a central resolution
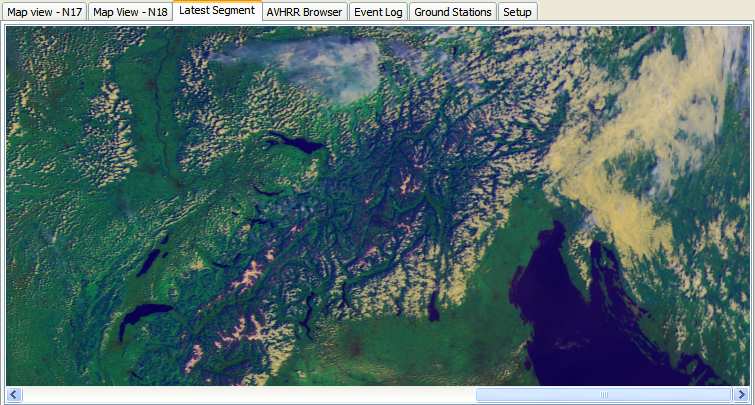
of 1km. During a pass, the latest received segment (a strip 300
lines high and 2048 pixels wide) can be displayed on the View latest segment
tab, as shown below. In this example, Lake Geneva, Lake Neuch‚tel and
Lake Constance in Switzerland are clearly visible, as is Lake Garda in
Italy. The Alps occupy the centre of the image, and the north of the Adriatic
Sea and Istria are visible to the right.
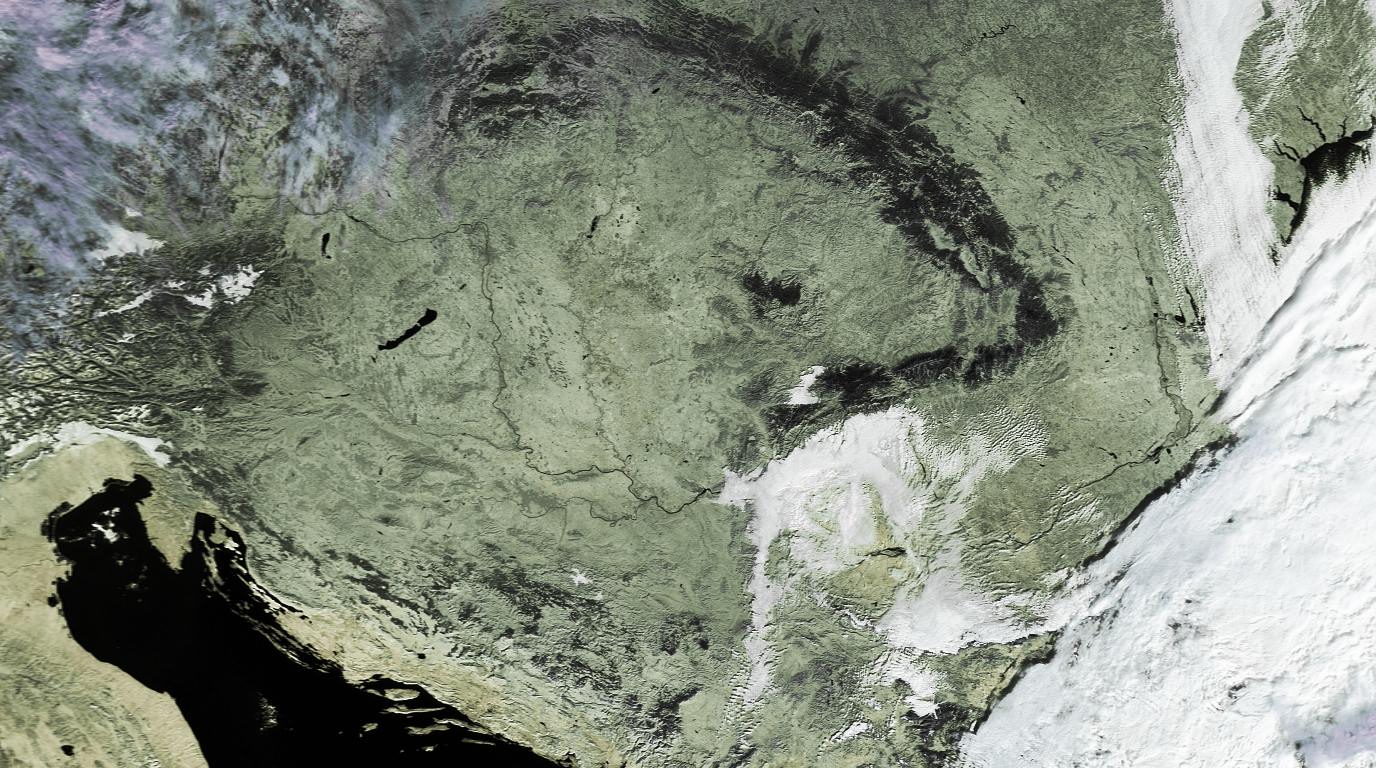
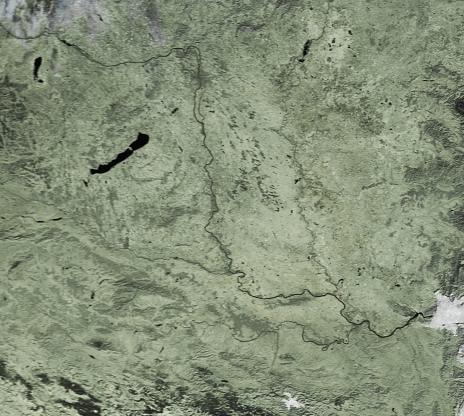
From more recent data (2006 Oct 31), here is a false-colour
image from NOAA-17 received through the AVHRR Manager, and subsequently
processed by my HRPT Reader software. I have used a
combination of channel 3 (near-IR 1.6Ķm) and the main thermal channel (4,
10Ķm) which brings out the river Danube very well. Click the image for a
larger area coverage image.
Click for a larger image
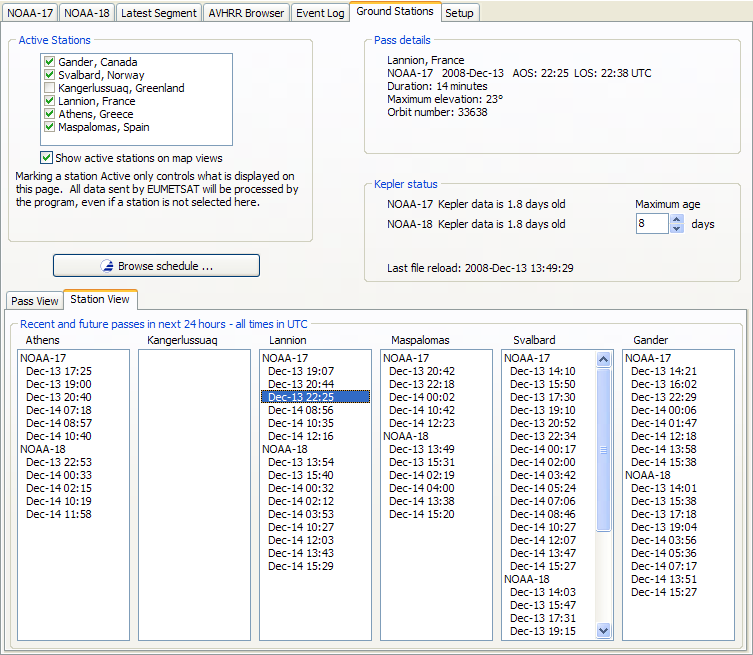
Here is the Ground Stations display in action. You can
select which ground stations are active, and browse the EUMETSAT pass
schedule. For each station, a list of passes is shown, and you can click
on a pass for more details. Here, I have clicked on the 22:55 NOAA-17 pass
at Lannion and the details are shown in the top right panel. There is a
panel where you can check the age of the Kepler data the program is using.
I suggest you don't allow it to be more than a few days out of date, and you can
set the threshold for the maximum allowed age here.
Requirements
- The program works with NOAA-19 & Metop-A/B/C AVHRR data sent over the EUMETCast
data stream. You need to register with EUMETSAT (free) to receive this
data.
- The program requires Kepler data, such as that from the
CelesTrak and Space-Track Web sites, and if you have my
Kepler Manager you
can automate the downloading of this data.
- I suggest that you install either the HRPT
Reader or WXtrack to help understand obtaining
and using Kepler data if this is new to you.
- To view the output from the program, you require a viewer
program such as my HRPT Reader (free version available).
- A screen resolution of 1024 x 768 may be required to
operate this software.
- The program is supported on Windows-7 and later, 32- and
64-bit versions,
and it
should work on Windows server equivalents (but has not been tested by me).
Earlier versions of Windows may also work but are no longer supported.
- For data capture alone, a 500 MHz PC with 512 MB of memory is
the minimum requirement. For processing the resulting files, a 1 GHz or
faster PC with 512 MB or more of memory is recommended.
- Be aware that the processed files, even with just the one
EUMETSAT HRPT station current in the trials phase, can produce about 1 GB of data per
day. You will need to size your disk accordingly. A good, fast
disk with a 16 MB or 32 MB buffer is recommended.
- Guidelines
on publishing EUMETSAT data.
- Some Windows 8.1 systems appear to make the AVHRR Manager
unresponsive after a period of operation. If this affects you, there
is an unsupported AVHRR Watcher program you can download here.
The Program in operation
There are six tabs in the main program display, and a single
start/stop button. You should first visit the Setup tab, and configure the
program to match the paths for data in your own system. Once this is done,
and you are receiving data, the output files should be named like: 2006-03-16_1024_noaa17_19357.raw16,
and you can double-click these files, and ask Windows to open them with the HRPT
Reader software.
Map View
The map view provides a quick visual check on the incoming
data. You can follow the progress segment by segment. Each segment
lasts one minute, and will appear as a curved strip on the polar stereographic
map projection used. The colours are a simple false-colour combination of
two visible and one infra-red channels, designed to provide a display under both
day and night conditions.
Latest Segment
The is provides a quick-look at the last one-minute segment
which has been processed by the program. As the image is only 300 pixels high, it will not occupy the
full screen height, but as it is 2048 pixels wide, a scroll bar is provided to
allow examination of the full image.
AVHRR Browser
Provides an explorer-like view into the available
thumbnail image and composite AVHRR data. A single button-click will
display data for today. Clicking on an image thumbnail file will display
the thumbnail in a small panel so that the pass location can be seen. The
composite AVHRR file matching the thumbnail can be opened with a button-click,
or by clicking the .hpt file. Please note that the HRPT Reader must be
installed on the PC for the open .hpt file function to work. A function
is provided to delete the AVHRR data and thumbnail image from unwanted passes
(such as ones outside your region of interest, or perhaps overnight passes).
Event Log
You can examine a log of the received segments on this tab.
The delay between segment capture time and reception time is shown. A pass
prediction for next 24 hours for each selected station is displayed in the lower
part of this tab.
Ground Stations
The stations tab allows you to tell the program which ground
stations are currently active, and whether those ground stations should be
displayed on the Map View. This does not affect the data received, just
the display. A list of passes expected at each ground
station is displayed, and details of a particular pass can be obtained by
clicking on the pass. The status of the Kepler data is shown - the age of
the Keplers for each satellite - and the last time that multi-satellite Kepler
data was reloaded. There is a pop-up hint on each Kepler age showing the
data source.
Setup
The setup tab allows you to match the program's data paths to
those of your system, and to customise a number of options.
- You can define the path to the Kepler data (and the Auto
button can help you), the path to the TelliCast received files (probably the
same as the "Received files location" in the MSG Data Manager, and
the path to the combined files. These combined files can be viewed
with the HRPT Reader.
- You can set how many days the combined files will be
kept. This enables you very easily to control the disk space used by
the program.
- You can choose to store the combined files in dated
folders, for ease of organisation.
- You can choose the path to store the segment files, if you
enable this option.
- You can have the program delete the raw data (this should
normally be enabled).
- You can choose if the program should delete other non-AVHRR
channel 1 data.
- You can have the program announce events like the start of
a new scan, and the arrival of a new segment. Please use the Windows,
Control Panel, Sounds applet to define the actual sounds.
Suggestions for new users
Important: having up-to-date Kepler information
is vital to the working of the AVHRR Manager software. If you are
at all unfamiliar with this aspect of using satellites, at the very least follow
step 1 below before installing and trying to use the AVHRR Manager.
- Download and install WXtrack, and
get that program working. Find out about updating the Kepler data from
the Internet, as
you will need reasonably fresh Kepler data to run the AVHRR Manager.
- Install the current HRPT
Reader, and become familiar with providing that program with the
multi-entry Kepler data.
Whilst the mixed Kepler data from the CelesTrak Web site https://celestrak.com/NORAD/elements/noaa.txt
is sufficient for satellite data near in time to the Kepler data, if you want to process older data (such as the AVHRR data from the EUMETSAT archive), having the multiple-entry Kepler data which includes data back to when the satellite was launched is a good idea.
You can use either the registered version of my Kepler Manager or perhaps the CelesTrak TLE Retriever to
keep your multiple-entry Keplers up-to-date.
If you have questions about the program, they may already
be answered in the general FAQs or the AVHRR
FAQs.
A self-help group is available for this
software at:
https://groups.io/g/SatSignal
| V4.0.2 |
Add Edmonton station, allow Edmonton to be
unselected, list stations in alphabetical order (were by latitude), minor
changes to Ground Stations tab layout.
|
| V4.1.2 |
Update for Metop-C, add Help|Support menu, recommend EUMETSAT Keplers to avoid excessively long files, correct handling of single-file multi-satellite Kepler data, note if WXtrack or the
HRPT Reader not found (for Kepler data), prevent browser Open and Delete buttons becoming randomly disabled.
If you don't already have an AVHRR Manager 4
key, contact me to purchase a licence update key before using this
software.
|
Important: this program has built-in 30-day trial
licence. If you just want to try the program, please do not run the
program until you know you are receiving the EUMETCast data! Once the trial 30-day
period has started, there is no way to reset it.
Beta version: This program is under continual
development - check here for the latest update.
Register
Depending on your needs, you can register either the AVHRR
Manager alone, and use your existing software for post-processing the data, or you
can get a package of well-known programs which will turn the data into images,
allow geographic map projection of the images, and automatically keep your
Kepler data current.
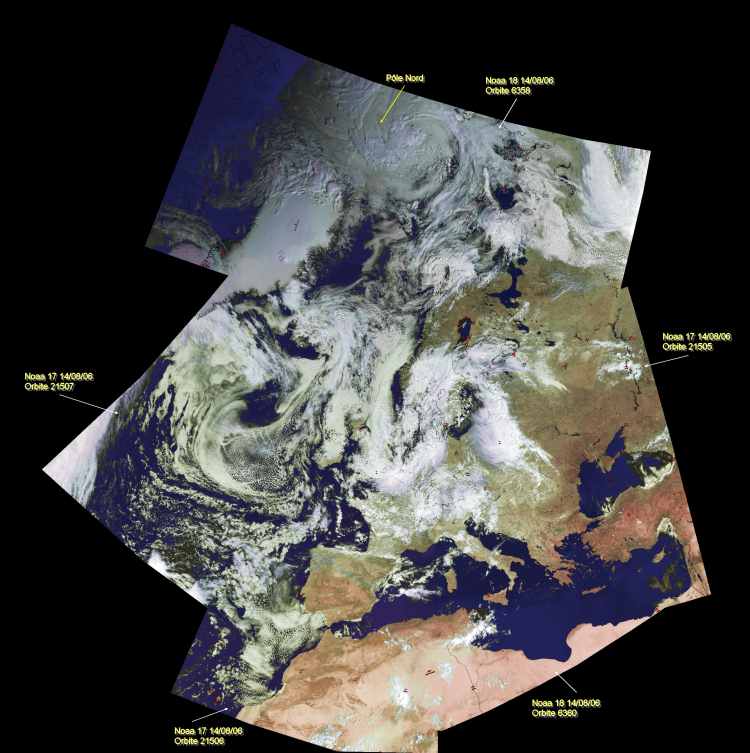
I was delighted to receive the image below from Gťrard Kruger
as an example of what can be done with programs from the HRPT Toolset.
Here, Gťrard has used the AVHRR Manager to capture the data, the HRPT Reader to
process the data from multiple satellite channels into a false-colour image, and
GroundMap to rectify the images into a common map projection. He has
combined the data from five satellite passes to produce a stunning image which
covers from Africa to beyond the North Pole. Many thanks, Gťrard, and to
EUMETSAT and NOAA for making this possible. You can click the image to the
full resolution image (about 500KB).
Click for the full-size image
|