


![]()


|
|
GroundMap
What is GroundMap?GroundMap is a tool to make your weather satellite
images fit standard map projections - a process sometimes called rectification
or geo-location - making it easy to join several NOAA satellite passes into one
composite image covering a much wider area, or to combine your satellite images
with other weather data. You can use data from either APT or HRPT
satellites. You need ground-location data produced either my WXtrack
program or SatSignal software for APT images, or by my HRPT Reader for
HRPT data. Because the images from each satellite are rectified to the
same projection on a black background, combining the data is turned into a
simple image addition task. As an example, here is a mixture of NOAA-16 and NOAA-17 passes
over Europe which have been rectified by GroundMap to a common projection and
subsequently combined. Never before have you seen images covering this
size of area at this sort of resolution!
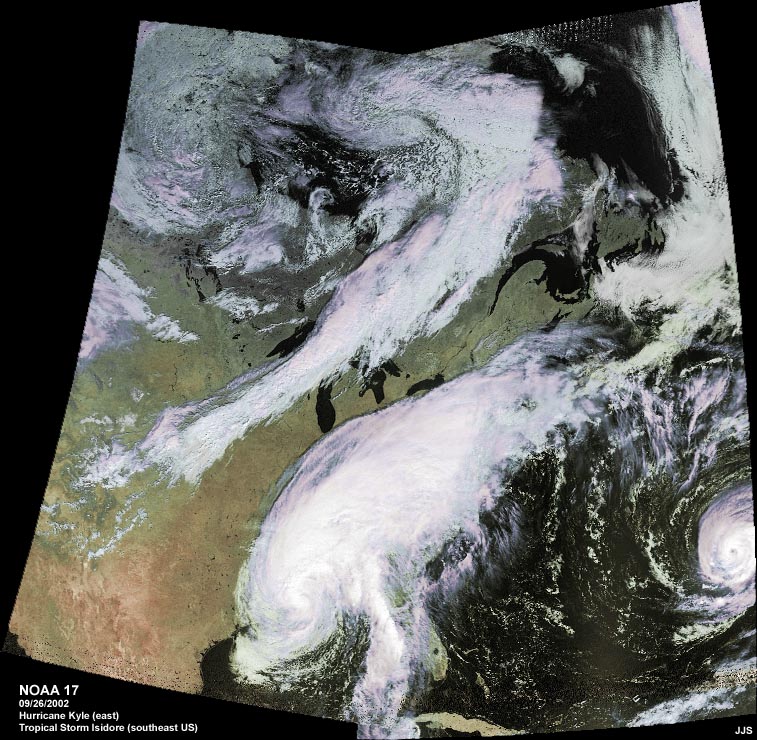
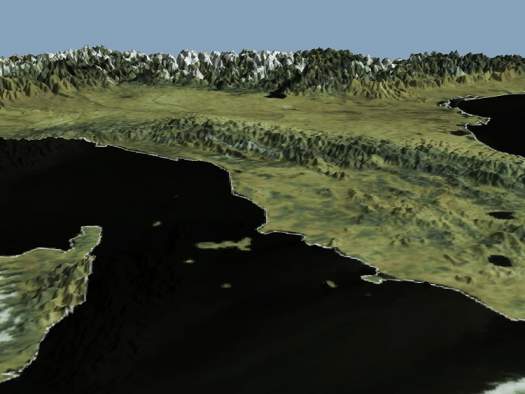
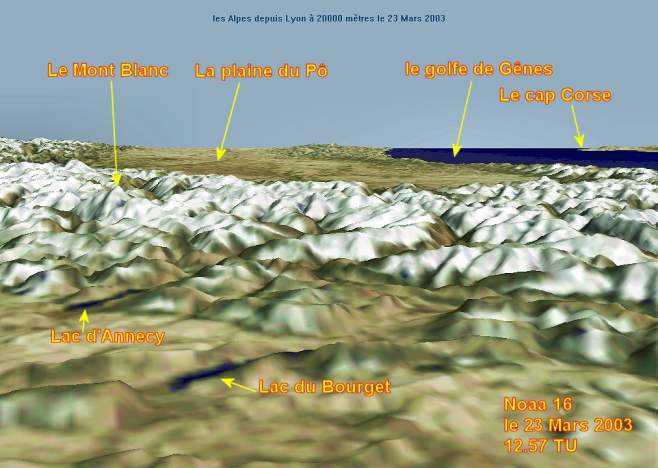
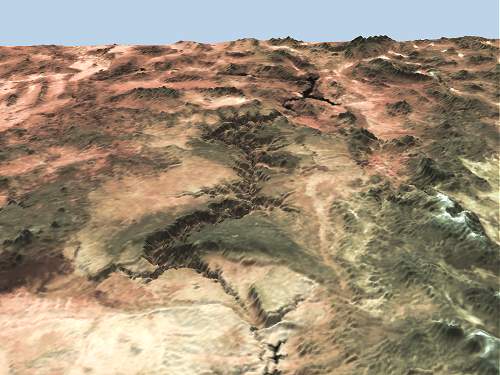
Do you have examples of images that can be produced?For the best images from GroundMap, produced by the expert himself, see Ferdinand Valk's Web site, in particular his Image of the day page. As an example, above is a thumbnail of composite that he produced from NOAA-16 and NOAA-17 for 14th September 2002. It covers from Egypt to Greenland, and the original image is 2955 x 2500 pixels. Even larger images are possible with the special-order Pro version of the program. I would welcome other samples to add to this page, with a link to your own Web site with the full image if possible. Here is an example made from APT data processed by my SatSignal program and combined in GroundMap by Jim Scheffler. It is from two NOAA-17 passes over the USA on 2002 September 26, and shows two hurricanes around the Gulf of Mexico. You can clearly see Tropical storm Isidore over the south-eastern US and Hurricane Kyle over the Atlantic ocean. Meteorologist Patrick Prokop at Savannah-Weather from WTOC-TV, Savannah, GA uses GroundMap to produce a regularly updated weather map image from multiple NOAA APT passes. By using the geographically rectified output from GroundMap, you can produce some stunning effects by using the 3DEM 3D Terrain Visualisation and Flyby Animation software with the image. Here are some results of this technique. The method was described in the RIG Journal 72 by Ed Murashie, to whom many thanks are due. You can even make an animation showing what it would be like flying over the terrain! There is an online tutorial available on Mike Long's Web site.
What data sources are accepted?Because GroundMap works with images, data from different sources can be combined as you wish. You will need an image processing program to do the actual combination, as you need to smooth the transitions in a way that is unique to each image and this is something that cannot easily be automated. GroundMap needs an image and location data for points in the image. For HRPT data, my HRPT Reader will provide the location data either from the data embedded in CLASS files, or from Kepler data that you provide. The location data is a .LCN file. For NOAA APT images, WXtrack produces the location data. Be sure to use contemporary Keplers to avoid errors. Once you have the image and the location data, they work as a pair, and you do not need to recompute the location data. Of course, once you have used GroundMap to rectify your satellite data, you can easily combine the result with other data which is in the same projection, such as weather radar, atmospheric pressure data, lightning data etc. which is all easily available on the Internet. Do contact me if you need a special image combining program written to combine data in this way, I have a lot of experience handling data in a variety of formats and mappings. Starting with GroundMap version 2, two important additions have been made to the data sources which can be accepted.
What facilities are in GroundMap?There is a detailed tutorial on Ferdinand Valk's Web site, which formed the basis for a later article, an earlier copy of which is included in the Zip file you can download below.
What does the special-order Pro Version add?With the special order pro version, you get a greater range of
output sizes (adding 4800 x 3600, 8000 x 6000, 9200 x 6900, 10400 x 7800, 16:9
formats 1280 x 720, 1920 x 1080, 2560 x 1440, 3840 x 2160), the ability to have a second boundary overlay for your
own data graphics display, the ability to save the output image in quadrants
e.g. for printing on multiple sheets, and an additional output projection
precisely matching Meteosat-9 geostationary images (3712 pixels square). Will the output line up with standard maps?Yes, there are a range of map projections provided with
GroundMap which are listed above, and remapped image should line up exactly with
other maps produced to the same standard projections. Of course, you may
need to rescale the map or your image by a fixed amount (equal in both
directions) to precisely overlay a particular map. Can I use my own settings?Yes, you can define as many user locations as you like.
This includes both the centre of the mapping and its span. These settings
can be recalled for future use. Download GroundMap
(please note that some of these features are only available in the special-order "PRO" version).
You may also require my runtime Library Bundle if this is the first item of my software you are using. |
|
|