


|
|
Some TelliCast Monitoring UtilitiesThese are all unsupported! Ask questions in the MSG-1 self-help
group.
Sample results are given below. Ernst Lobsiger's TClog Summary
Please note: For automated running of the script you need to call it with a parameter, and typically that will be "yesterday" so your command will be something like: C:\Tools\Admin\TClogSummary.cmd yesterday Sample output from TClogSummary
|
TelliCast statistics for Alta using Ayecka SR 1 #1 on DVB-S2 Basic Service
YYYY-MM-DD      hh:mm   Recov.  Missed  Bytes           Packets
                 UTC    Packets Packets Received        Received
2016-02-25      00:29   0       0       1165451782      1001197
2016-02-25      00:59   0       0       2451500609      2106033
2016-02-25      01:29   0       0       3525412506      3030553
2016-02-25      01:59   0       0       4671202819      4012991
2016-02-25      02:29   0       0       6077109660      5221143
2016-02-25      02:59   0       0       7014155850      6026827
2016-02-25      03:29   0       0       8078806836      6942455
2016-02-25      03:59   0       0       9425009879      8097358
2016-02-25      04:29   0       0       10696189623     9190491
2016-02-25      04:59   0       0       11823075854     10157935
2016-02-25      05:29   0       0       12843800944     11034487
2016-02-25      05:59   0       0       14288205079     12274594
2016-02-25      06:29   0       0       15349943793     13189119
2016-02-25      06:59   0       0       16568947561     14234760
2016-02-25      07:29   0       0       18048761202     15505060
2016-02-25      07:59   0       0       19137330458     16441035
2016-02-25      08:29   0       0       20469455966     17584794
2016-02-25      08:59   0       0       21708346413     18646746
2016-02-25      09:29   0       0       23134286153     19872370
2016-02-25      09:59   0       0       24373336454     20936325
2016-02-25      10:29   0       0       25494842748     21899236
2016-02-25      10:59   0       0       27225609488     23382824
2016-02-25      11:29   0       0       28363162218     24361825
2016-02-25      11:59   0       0       29625264052     25444851
2016-02-25      12:29   0       0       31372658007     26942699
2016-02-25      12:59   0       0       32554347386     27958556
2016-02-25      13:29   0       0       33743539691     28980370
2016-02-25      13:59   0       0       35161091124     30194893
2016-02-25      14:29   0       0       36768590715     31575191
2016-02-25      14:59   0       0       37864228272     32516097
2016-02-25      15:29   0       0       39067750211     33549572
2016-02-25      15:59   0       0       40798706094     35033216
2016-02-25      16:29   0       0       42010169955     36075014
2016-02-25      16:59   0       0       43264752692     37150912
2016-02-25      17:29   0       0       44578891186     38279690
2016-02-25      17:59   0       0       45648334248     39199612
2016-02-25      18:29   0       0       46950397627     40318805
2016-02-25      18:59   0       0       47998914104     41219241
2016-02-25      19:29   0       0       49275852811     42318020
2016-02-25      19:59   0       0       50545699165     43409015
2016-02-25      20:29   0       0       51497137584     44227175
2016-02-25      20:59   0       0       52725859647     45281834
2016-02-25      21:29   0       0       53782805639     46192252
2016-02-25      21:59   0       0       54957948827     47200585
2016-02-25      22:29   0       0       56134560988     48212397
2016-02-25      22:59   0       0       57360093423     49265143
2016-02-25      23:29   0       0       58460169049     50211649
2016-02-25      23:59   0       0       59465280387     51073384
|
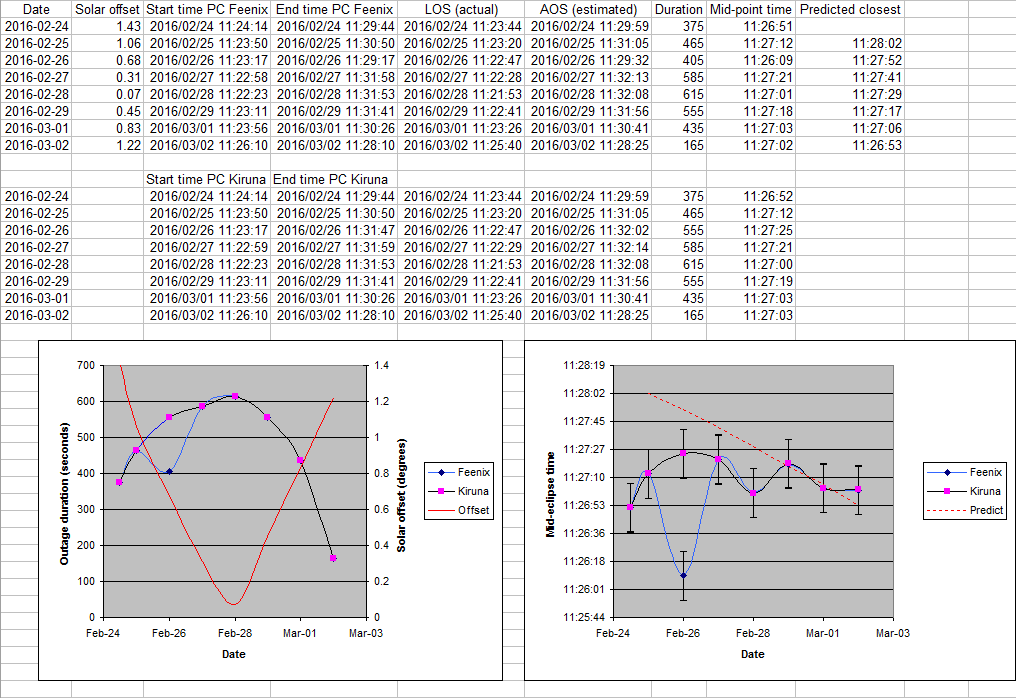
Here is the result of using the output from Ernst Lobsiger's TClogSummary program to compare the expected and actual outages due to the sun being directly in line with the EUTELSAT 10A from which the DVB-S2 service is broadcast. More about solar outages. As the sun is a prolific radio noise source, it causes the signal to noise ratio of the signal to be decreased, and with the signal level here the decrease is enough to trigger the Ayecka SR1 to stop receiving the High Volume Service (HVS) over EUMETCast. Such events can be recorded by TelliCast (see here) and the times of signal loss and re-acquisition are logged.
Here are the results from a couple of systems in Edinburgh in Spring 2016. As the error-script is only triggered 30 seconds after LOS, 30 seconds must be subtracted from the time recorded. Similarly, as it is uncertain within 30 seconds as to when the signal returned, 15 seconds has been added to the last times recorded as a best approximation. I've also plotted the solar offset so that you can judge how accurately the antenna is aligned! It seems to be that the elevation is spot-on, as the day with the longest outage is the day with the closest approach. I plotted the theoretic mid-time of the outage versus the mean of AOS and LOS times, but these results appear much more variable. Comments welcomed.
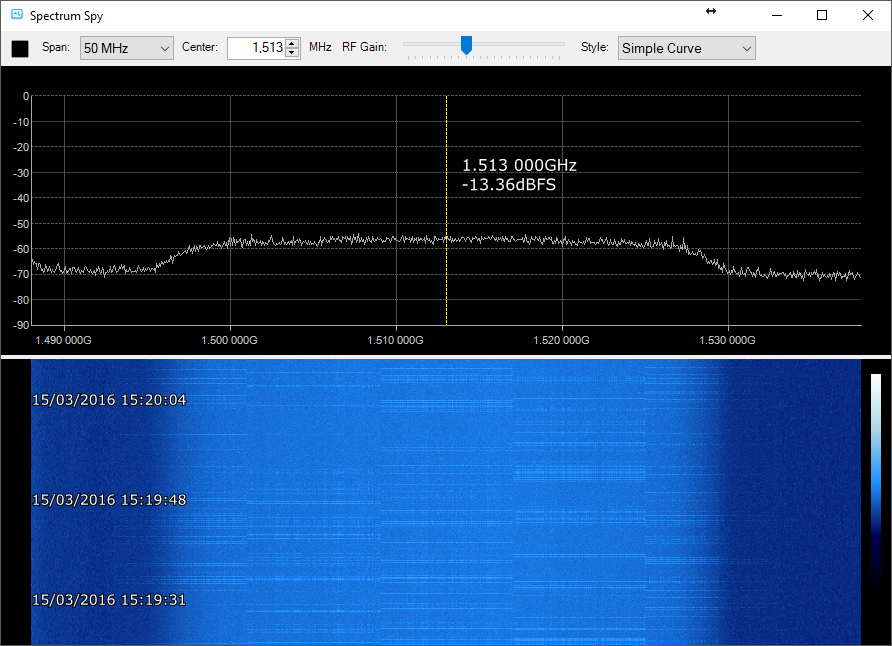
I recently attempted to measure the DVB-S2 spectrum, using an Airspy receiver connected via a 2-port splitter to and active LNB. The new SpectrumSpy program was used. I was surprised to see the spectrum varying in amplitude, possibly corresponding to periods when a particular MODCOD is sent. Unfortunately the spectrum is measured in 8 MHz chunks, so this higher amplitude shows as an 8 MHz burst, although it's likely that it spreads the full width. The three frame types are: 8PSK 3/5, 16APSK 2/3 and "Dummy PLframe".
Here is the "steady" spectrum. In the waterfall display (lower) you can see lighter lines, 8 MHz wide, which are the different frames I am asking about. I took this screenshot when these frames were not active.
Here is a screenshot showing the sane as above, but one of the mystery frames active:
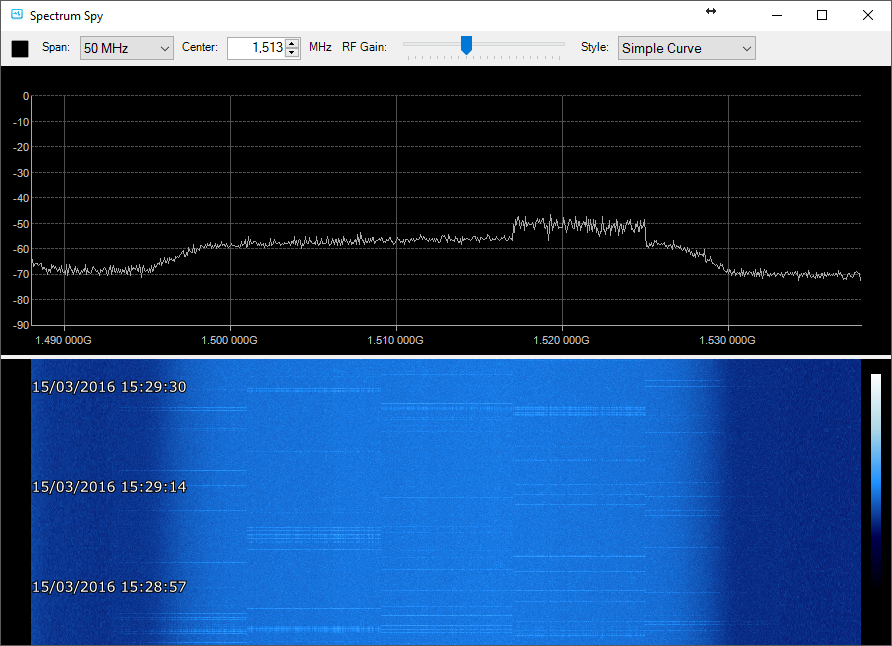
The extra appears to be at a level some 7 dB greater than the base signal. Of course, there may be artefacts caused by the spectrum analyser software responding differently to different frame types, and the providing a false impression..
Your thoughts would be welcomed!
|
|