|
| |
Here are some results that I've had with the NOAA weather satellites.
These are intended to show the typical results you might get, you will find better results
elsewhere on the Internet. I also hope to illustrate what happens if you use a
scanner rather than a "proper" receiver, but I don't have a direct comparison.
(This page contains images which might take a few seconds to download).
| Using a scanner as the receiver, and some sort of outside antenna,
you might get a result like this. It shows that there are two side-by-side images
being sent, a visible and and infra-red, and that the left-hand visible image changes to
mid infra-red about 2/3 of the way up the left-hand side, when solar illumination is too
weak. As the frequency deviation of the infra-red signal happens to be greater, the
scanner cannot cope, and a much noisier image results. Note that the WXSat program
halves the horizontal scaling to show both images at once. |
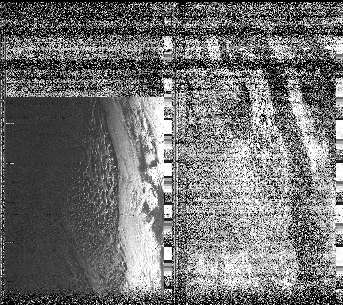
(Visible part of picture considerably enhanced)
|
 |
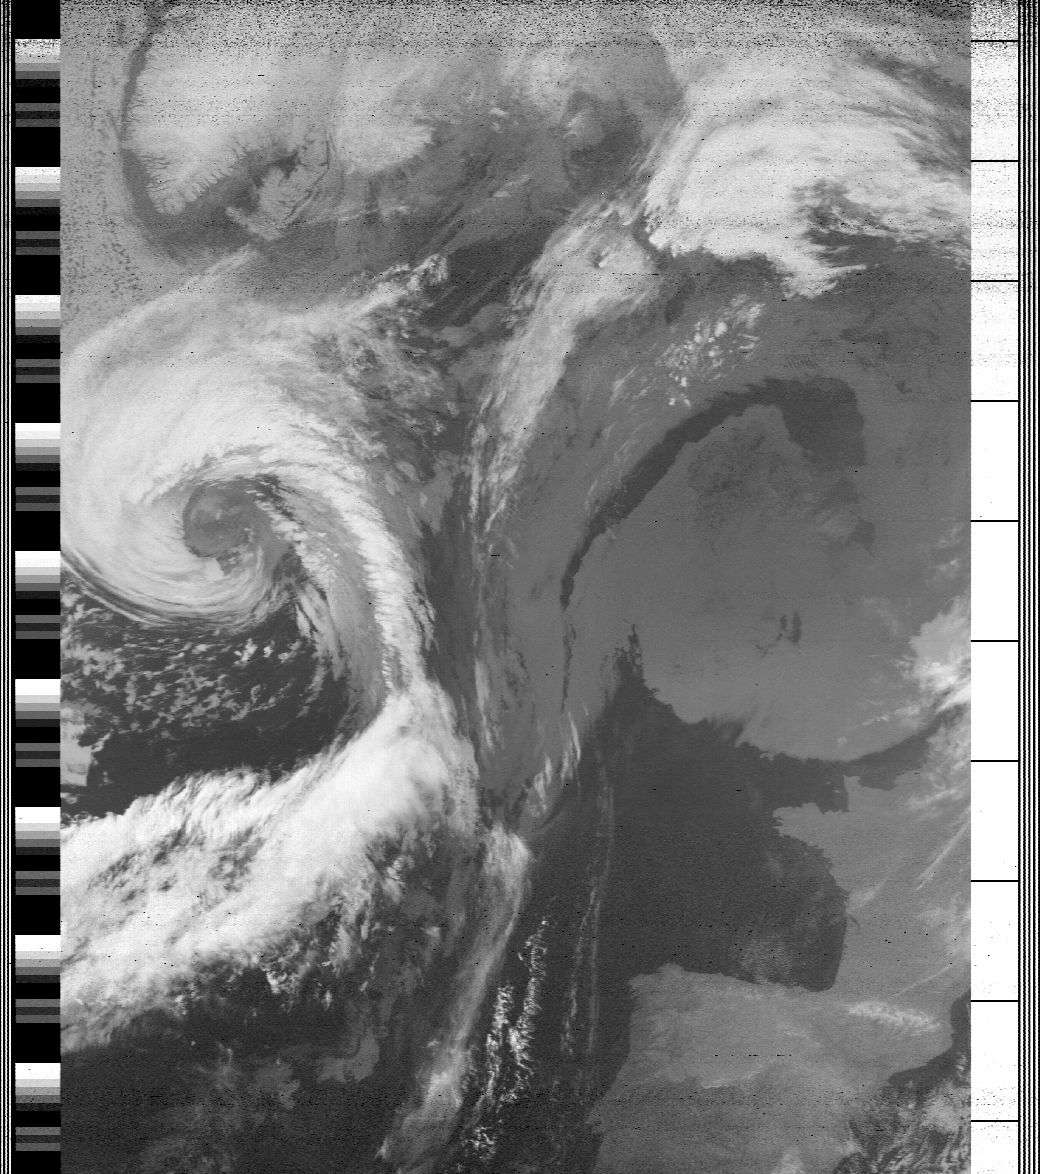
Now let's see what happens if you add a better antenna (QFH in the
loft) and a proper receiver. As this was evening, the pictures are far-IR and mid-IR.
There is much less noise on the IR images, and you can make out the UK, Ireland and
Iceland fairly well on the left-hand image. Now we can use a standard image
processing program such as Paint Shop Pro to enhance
the picture by stretching the contrast range. (WXSat also has facilities to do this
either live or when replaying from a standard Windows WAV file). Note
that there are calibration marks (variable brightness strips) and timing marks (horizontal
dashes) in addition to the picture information. |
| So with all the processing the details of the land masses are
enhanced, as are the horizontal lines caused by the pager transmissions which share the
same frequency band. I hope you can recognise the UK under all that, with Iceland
towards the top of the picture! If these pictures appear too dark, make
sure your monitor is correctly adjusted to see all six steps in the greyscale test pattern
below as clearly distinguished brightness levels.

For
a more comprehensive monitor calibration chart, please see here. |

Click for the full-sized image (127 KB)
|
| Some more pictures to ponder - click
for a full-size image |
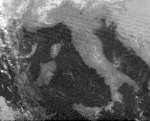
(19 KB)Evening over Italy, with neighbouring islands
clearly visible (IR). Some RF interference and slightly poor signal. |
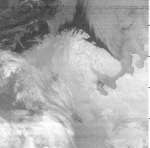
(31 KB)The North Cape, late January -- why is so clear
here? And doesn't the land look cold (white)! (IR) |
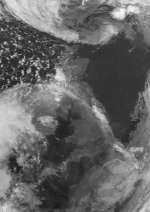
(36 KB)Early Sunday morning over the UK - are those faint
aircraft trails into Heathrow? (IR) |
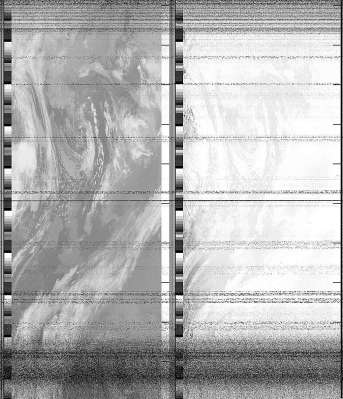
| Here we can see the effects of image processing, and a Russian
rather than American satellite, RESURS. Taken over Iceland on 1999 Jan 28, at noon
UTC, simple gain enhancement would bring up the interference bands, but Paint Shop Pro's
despeckle filter removes much of the weaker interference, whilst leaving most of the
detail. |
As received with interference bands
|
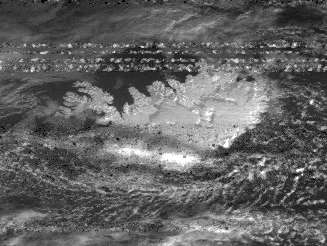
After processing
|
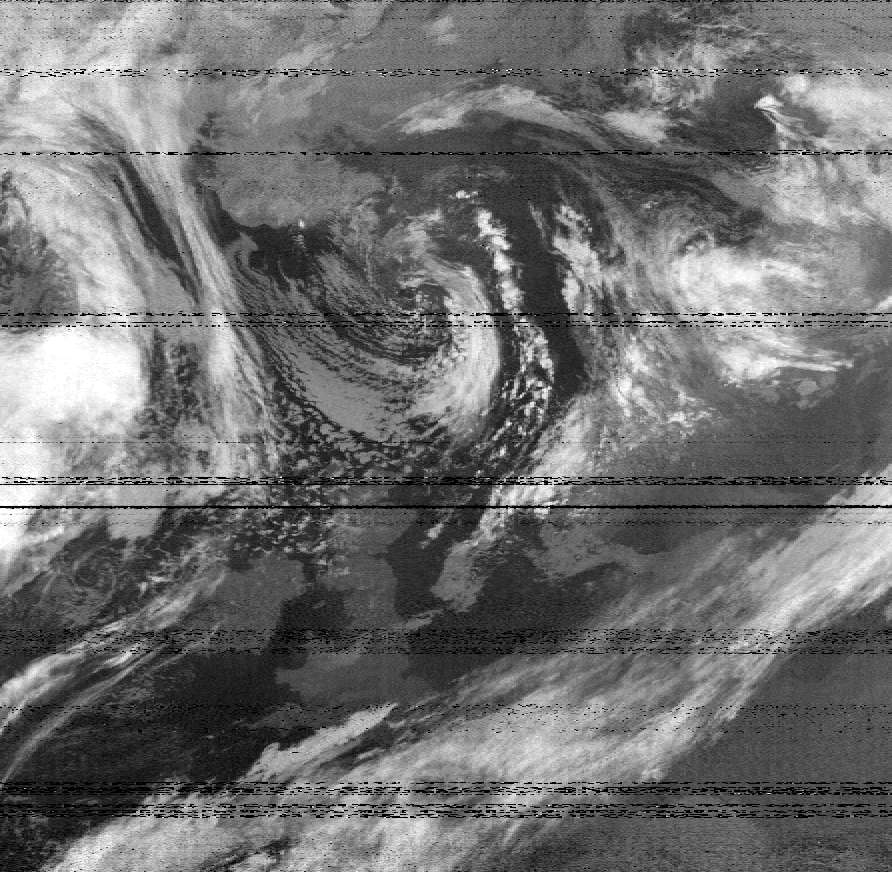
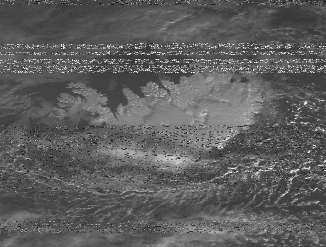
This is one I was very pleased to get.
Not only is it virtually interference free (just luck on a Sunday evening, Jan 31)
but it shows both a low pressure out in the Atlantic, and a warm (dark) patch over
Scotland with the country just showing through.
If you download this image, try making it negative - i.e. white is hot - and look how the
air over Scotland is warmer than most of France and Spain. No, I don't expect it to
last....One small aim is to convert this infra-red image into
temperatures using the calibration marks on the left-hand side of the picture...... |

Click for full-size image (226 KB)
|
|