Eurobird-9A - comparison of EUMETCast and GlobeCast transponders
This shows the comparison of two different transponders on Eurobird-9A, one carrying the EUMETCast transmission, and the other a GlobeCast transmission. Links to the full graphs can be found at the bottom of this page, here I compare the results from two near-identical systems placing the graphs next to each other.
See also:
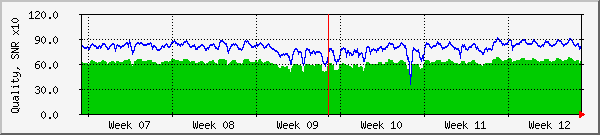
The GlobeCast data was recorded between 15:35 UTC on 2009-Mar-14 and 19:50 UTC on 2009-Mar-21, week 12. You can see the step down on the daily graph for GlobeCast where the PC was switched from GlobeCast to EUMETCast.
I find it difficult to draw very definitive conclusions from these graphs, especially when compared with data from other sources.
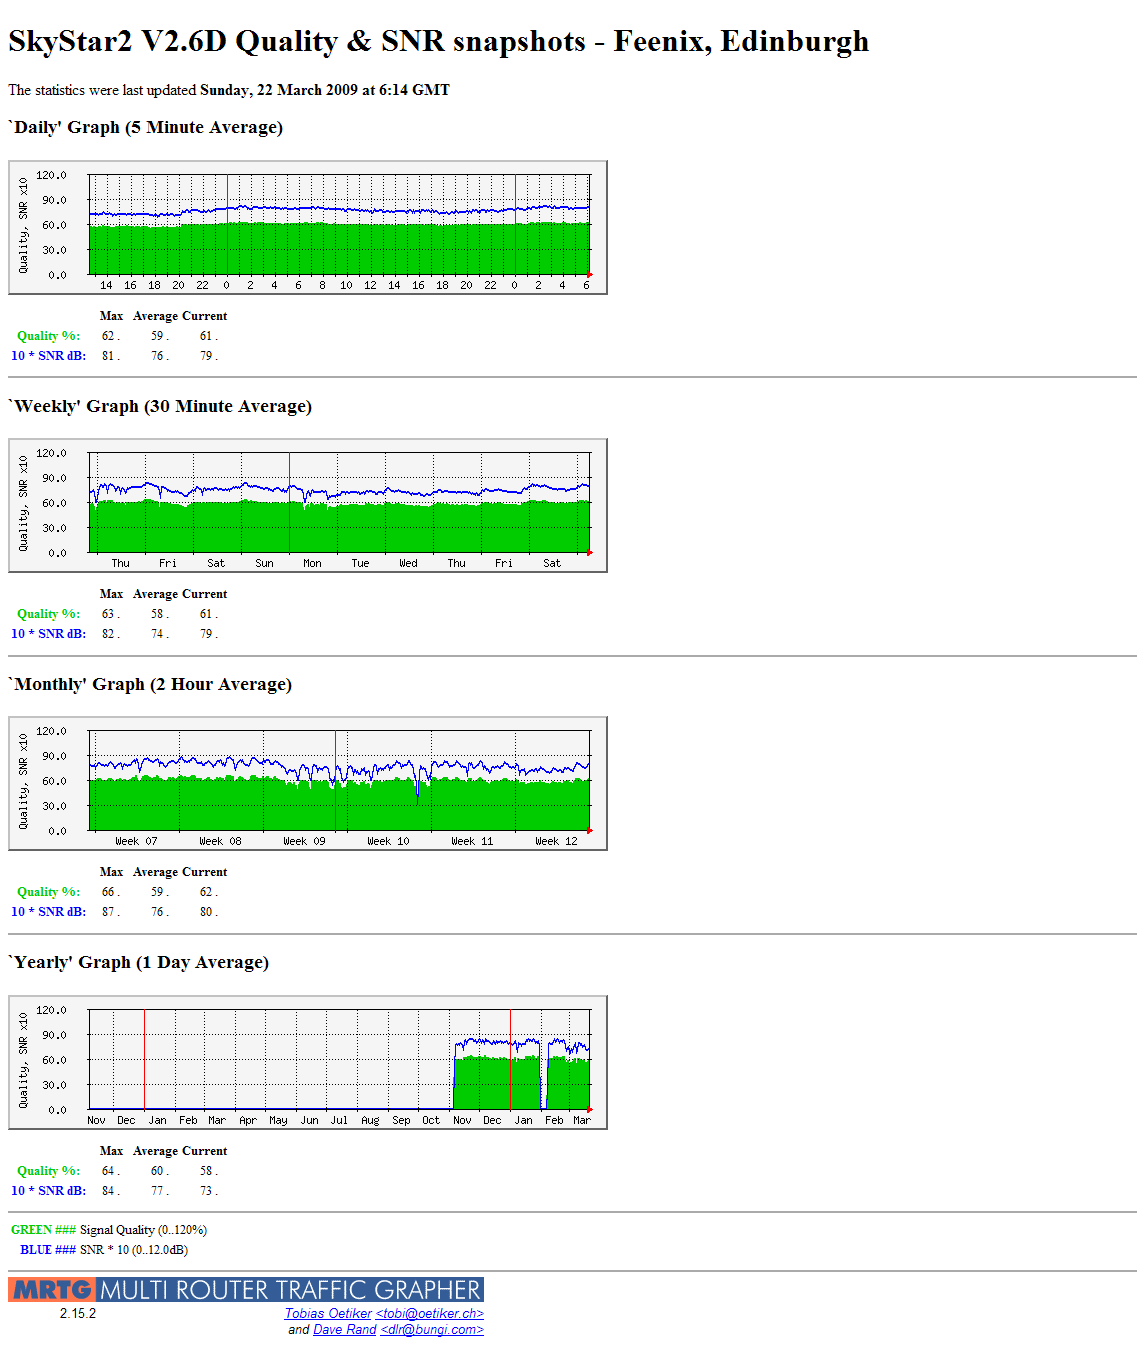
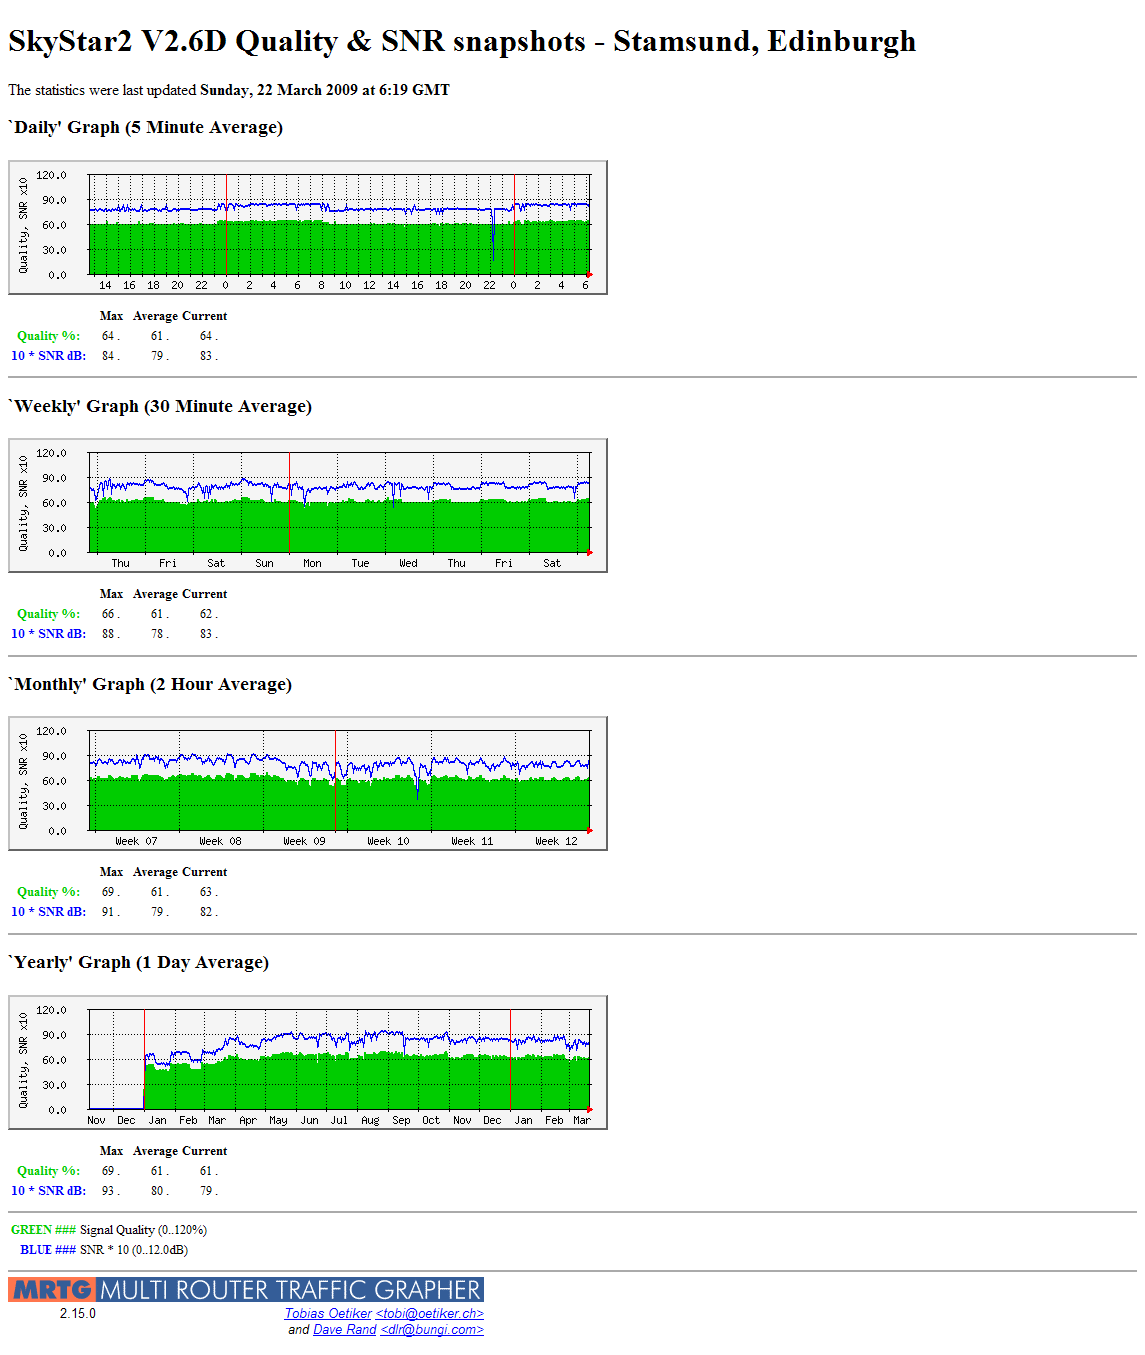
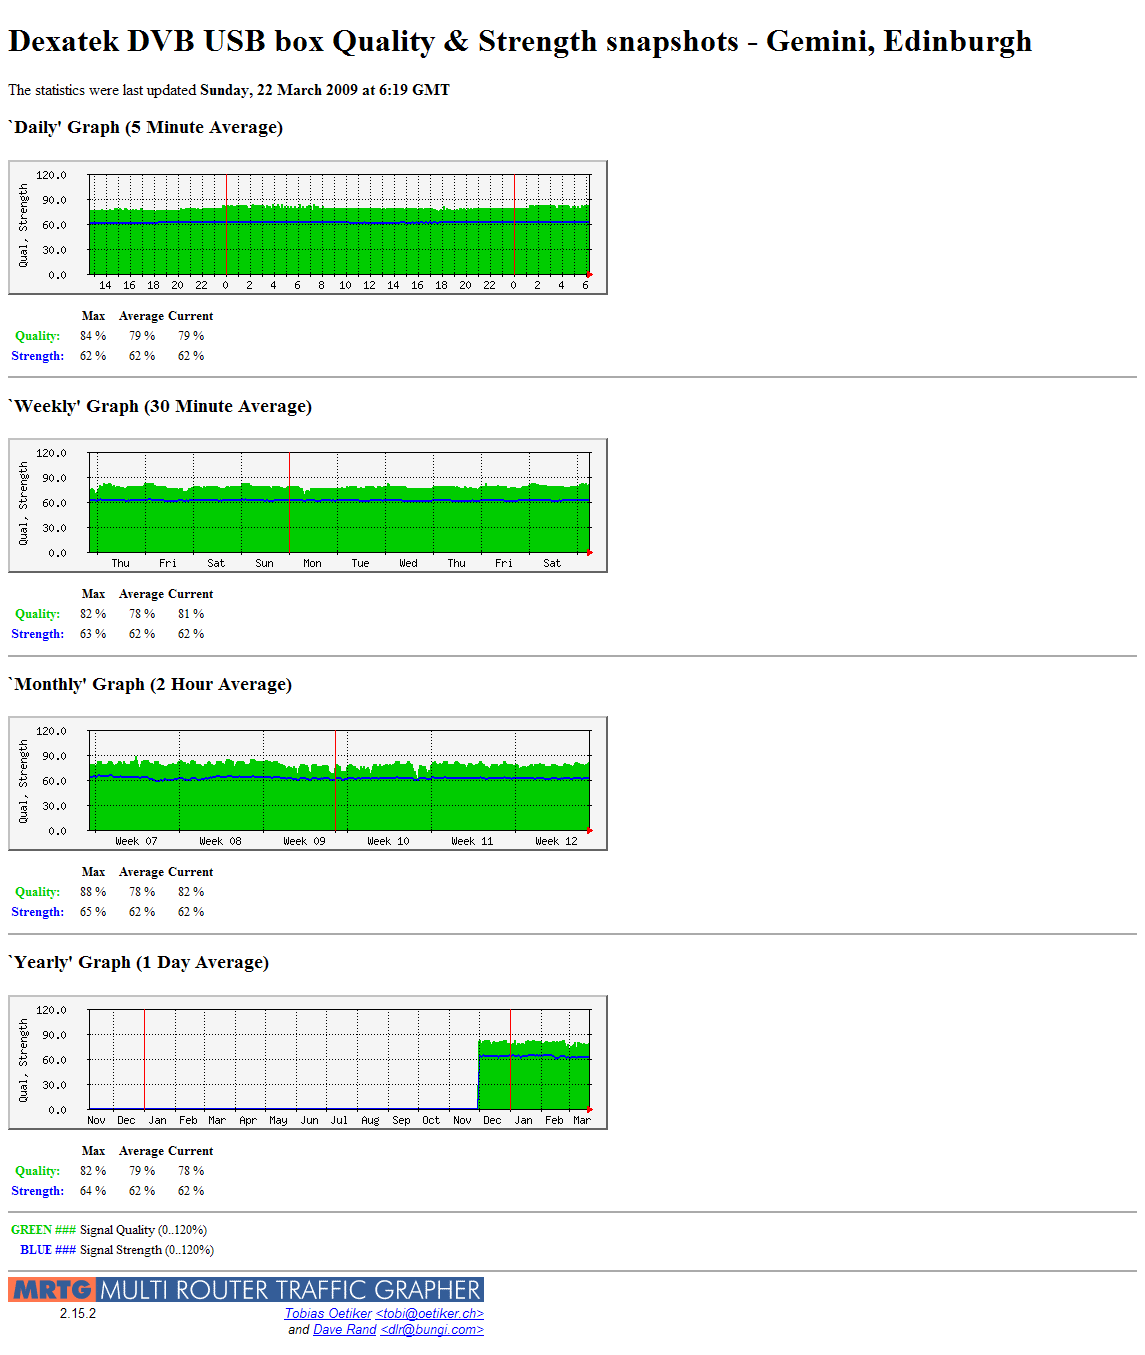
- The performance of the two systems on the EUMETCast transponder is very similar.
- From the monthly graph, it is obvious that a higher SNR was seen on the GlobeCast transponder, perhaps by about 1dB.
- There also appears to be an increase in Signal Quality on GlobeCast by approximately 7%.
- EUMETCast shows a diurnal variation of up to 1dB.
- GlobeCast appears to show a diurnal variation of approximately 0.7dB.
- The diurnal variations of the EUMETCast and GlobeCast signals are in phase.
- The EUMETCast signal has been more variable during March, and poorer than earlier.
From Arne's graphs, I might conclude:
- The GlobeCast signal does have a slight diurnal variation, peaking just after midnight like my two signals. Arne sees less variation - perhaps 0.2-0.4dB.
- The EUMETCast signal shows a greater diurnal variation - perhaps 0.5dB or more. However, Arne gets a maximum value during the middle of the day, as opposed to my maximum of the middle of the night.
- The EUMETCast signal has been roughly steady since the beginning of March, and better than earlier.
- The EUMETCast signal is about 1dB down on the GlobeCast signal.
| Daily | 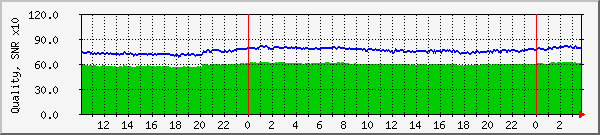 |
EUMETCast
|
||||||||||||
|---|---|---|---|---|---|---|---|---|---|---|---|---|---|---|
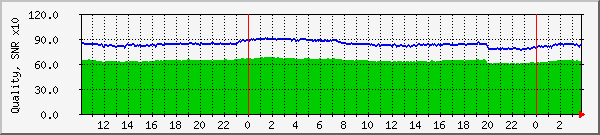 |
GlobeCast
|
|||||||||||||
| Weekly | 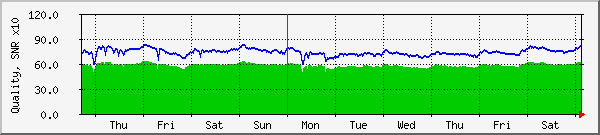 |
EUMETCast
|
||||||||||||
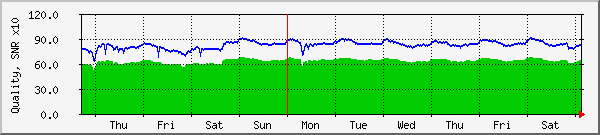 |
GlobeCast
|
|||||||||||||
| Monthly |  |
EUMETCast
|
||||||||||||
 |
GlobeCast
|
Arne van Belle's Comparative Data
| EUMETCast | 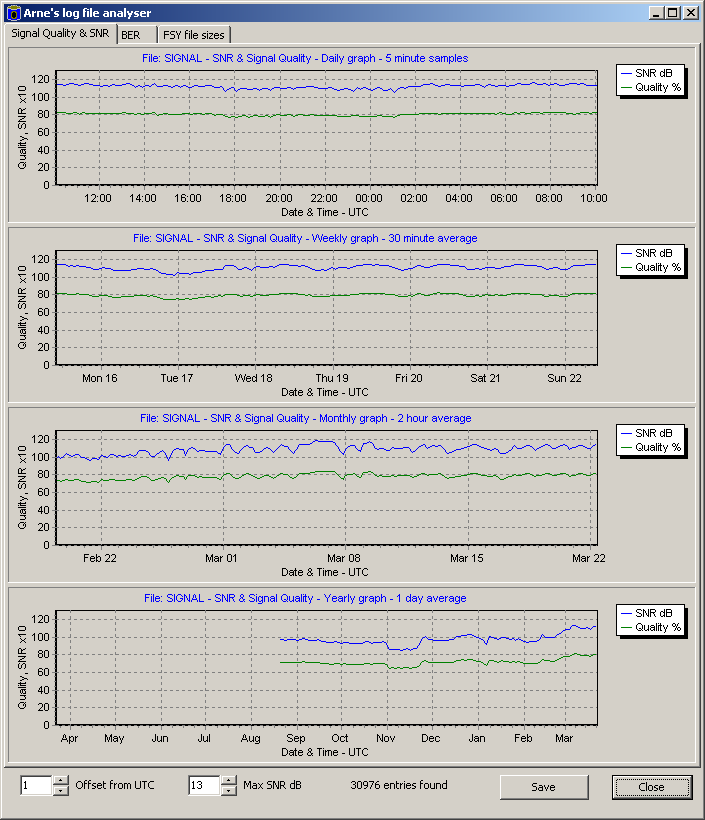 |
|---|---|
| GlobeCast | 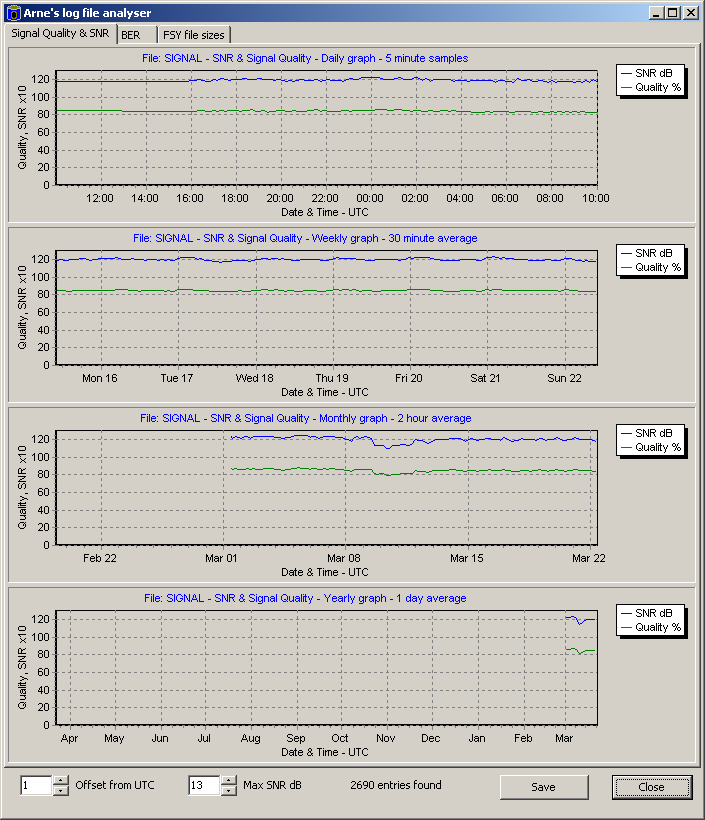 |
| Telefonica | 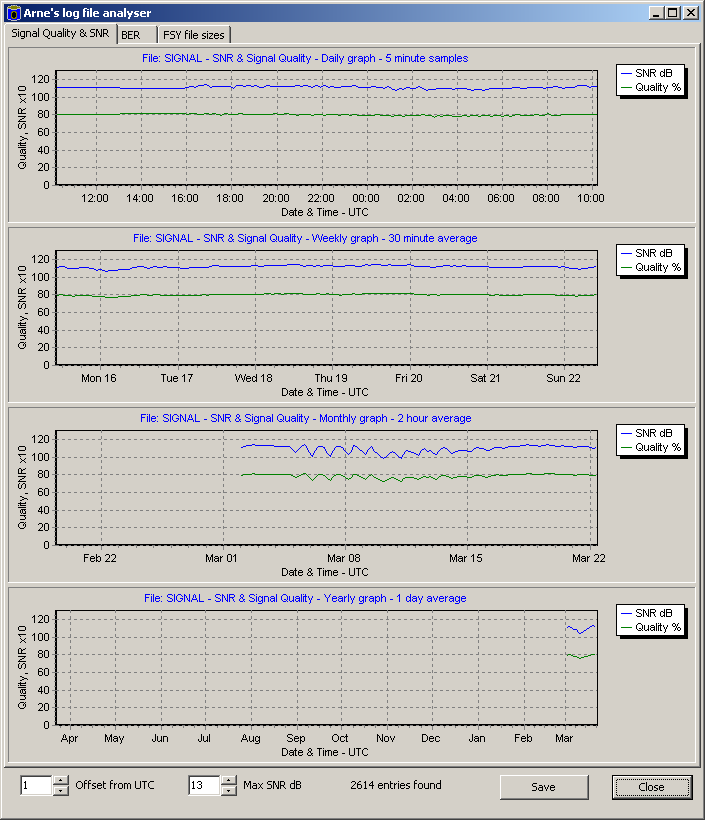 |
Original graphs - links to PNG images
Feenix - all EUMETCast
Hydra - a week of GlobeCast
Stamsund - all EUMETCast
Gemini - all EUMETCast but on a Dexatek USB box