TSC Interpolation
TSC interpolation for more accurate time recording
NTP is one of my interests, and while that program works very well on both
32-bit and 64-bit Windows of various ages, its interpolation routine has
problems with the more recent versions of Windows (Vista and Windows-7), so my
interest was piqued by this
Web page, which describes obtaining accurate timestamps under Windows
XP. So I transliterated the code to Delphi, my preferred programming
language, and used the TSCcalibrate program to calibrate my systems. No
systems were greatly different to the expected values. I then wrote a
program to compare the results with a timestamp obtained from the routines
described on that page with a timestamp from a GetSystemTime call.
recalibrate

t1 := NowUTCfromGetSystemTime
repeat
until t1 <> NowUTCfromGetSystemTime

repeat
  t1 := NowUTCfromGetSystemTime
  t2 := NowUTCfromTSCinterpolation
  delta := t2 - t1
  plot delta
until sufficient results plotted
The results are show below for a variety of PCs, processors, and versions of
Windows. To summarise:
- One PC tested with Windows XP showed a distribution which had a uniform
14.7 ms top, flanked by sides of approximately 1 ms slope, making a total
distribution width of 16.7 ms. However, the distribution started with
an offset between -2.9 and 0 ms. The same was seen on two Windows-8
PCs.
I had expected a more uniform distribution, and I had not expected the 16.7
ms width, but more the 1 ms width. To my inexperienced eye, this
appears to be the convolution of two uniform distributions - one of 1 ms
width, and one of 15.6 ms.
- Windows-XP Intel dual-core
- Windows-8/32 Intel dual-core
- Windows-8/64 Intel quad-core
- Three PCs showed a uniform distribution of about 1 ms width, with no
flanks. This is the distribution I was expecting. The
distribution started between 0 and 1 ms, which might depend on when
the mail data collection loop started. To try and remove this effect,
the program did try to synchronise to changes in GetSystemTime as show
above, but this does not seem to have had the desired effect.
- Windows-Vista Intel dual-core
- Windows-7/32 Intel Netbook
- Windows-7/64 Intel quad-core
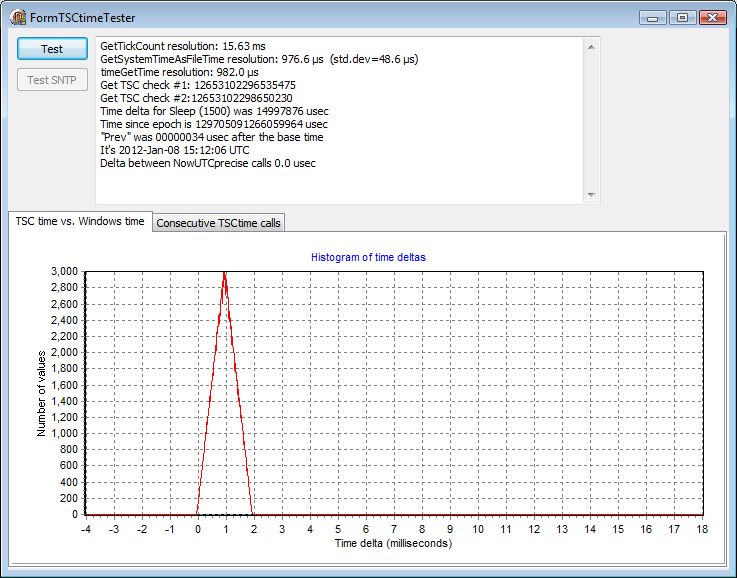
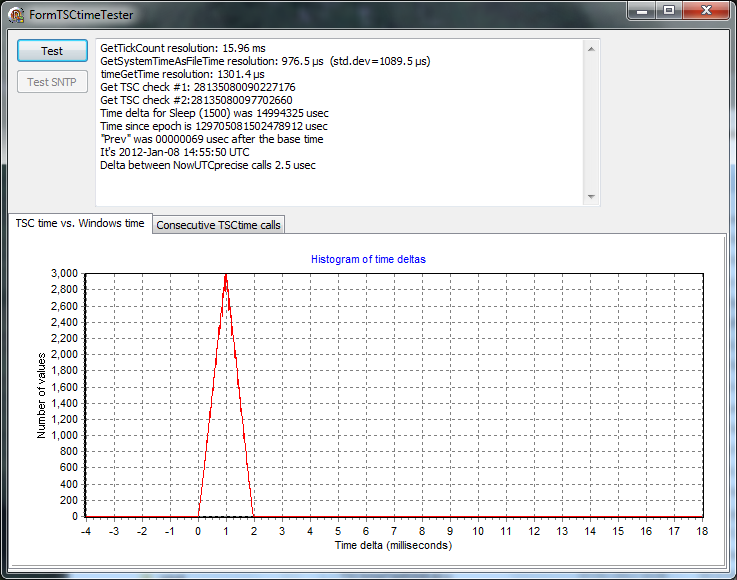
- Three PCs showed a triangular distribution, of about 2 ms width,
suggesting the convolution of two uniform distributions each 1 ms
width. I wonder whether this might be from the two cores having
different times, but the effect was also seen on the single core PC.
- Windows-Vista AMD dual-core
- Windows-7/32 Intel Pentium HT
- Windows-7/64 AMD single-core
I would be delighted to hear any explanation for these results! The
essential parts of the Delphi source code are here.
PC Narvik - Windows-XP SP2
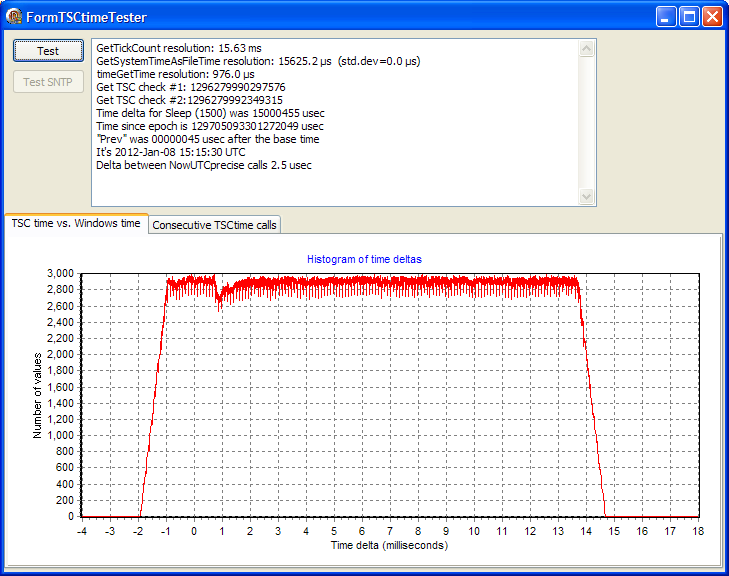
Note that, despite appearances the Multimedia Timer was running during
this test. The start of the 1 ms ramp leading up to the steady part of the
histogram varied between 0 ms and -2.9 ms.
PC Narvik - Windows-XP SP3
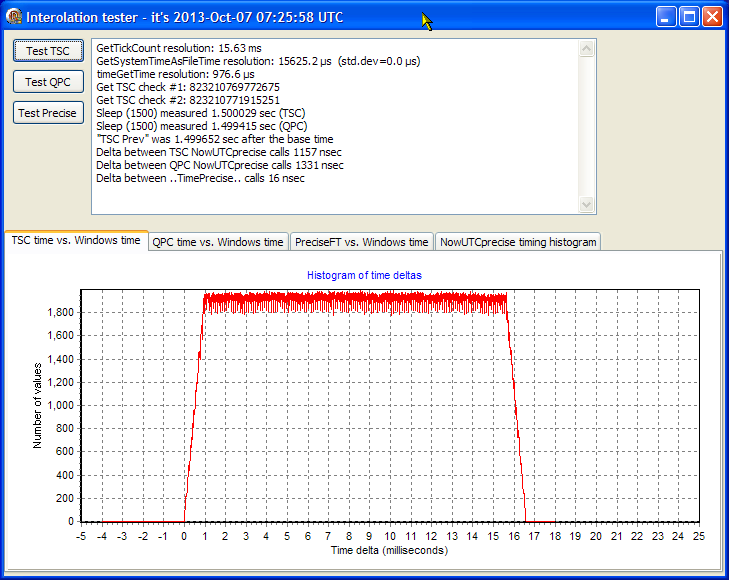
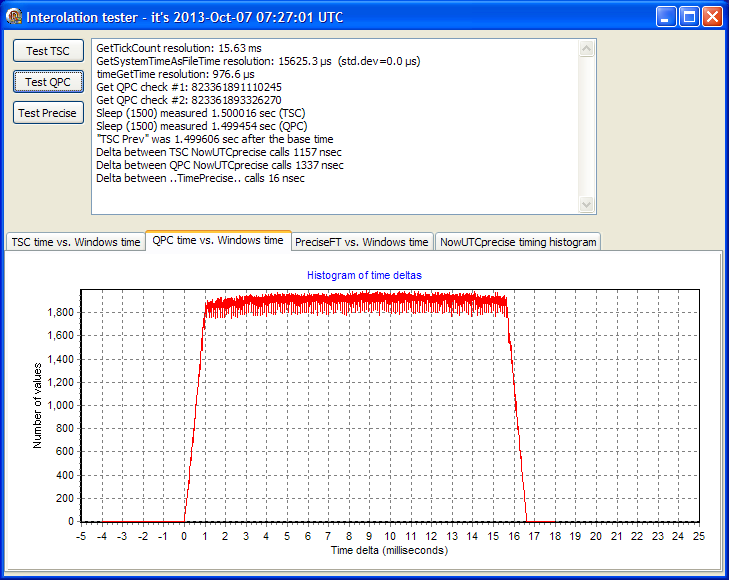
Same as above except using QPC version instead of TSC version.
Using RDTSC as per the original article
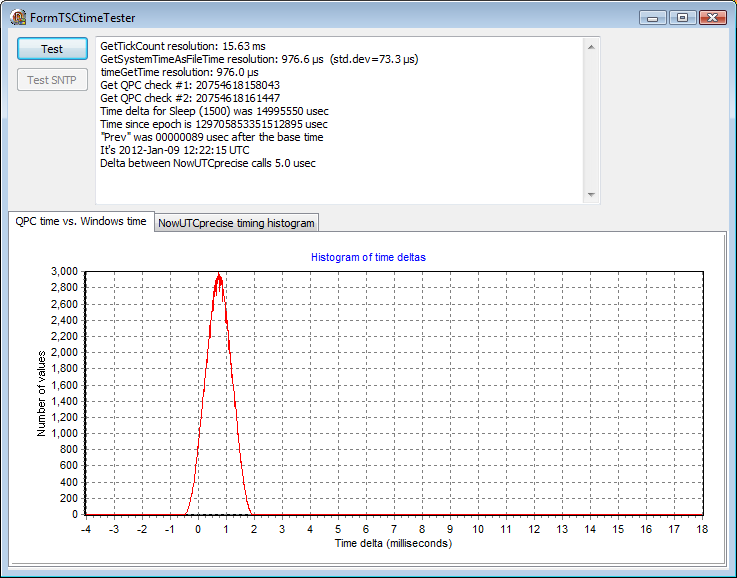
Using QueryPerformanceCounter instead of RDTSC
PC Puffin - Windows-Vista - Intel Core 2 Duo
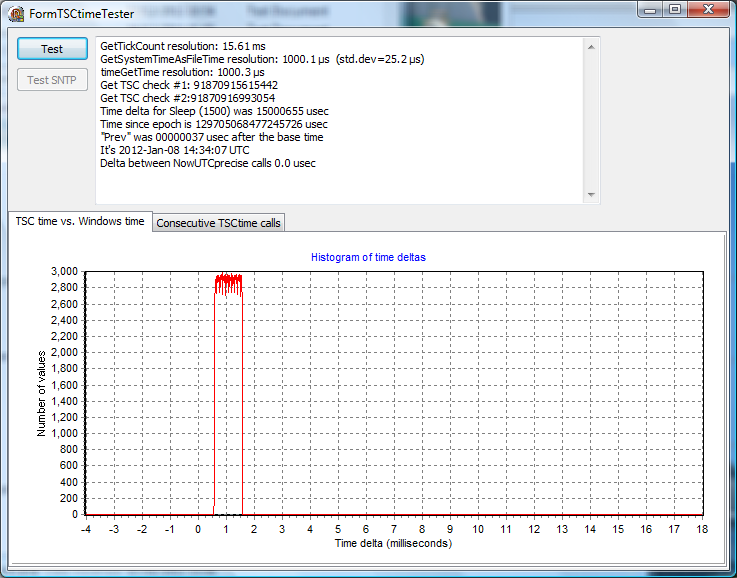
With this Windows Vista-32 PC, the uniform 1 ms second distribution always
started within the 0..1 ms interval.
PC Stamsund - Windows-7/32 - Intel Pentium 4 HT
PC Ystad - Windows-7/32 - Intel Atom netbook
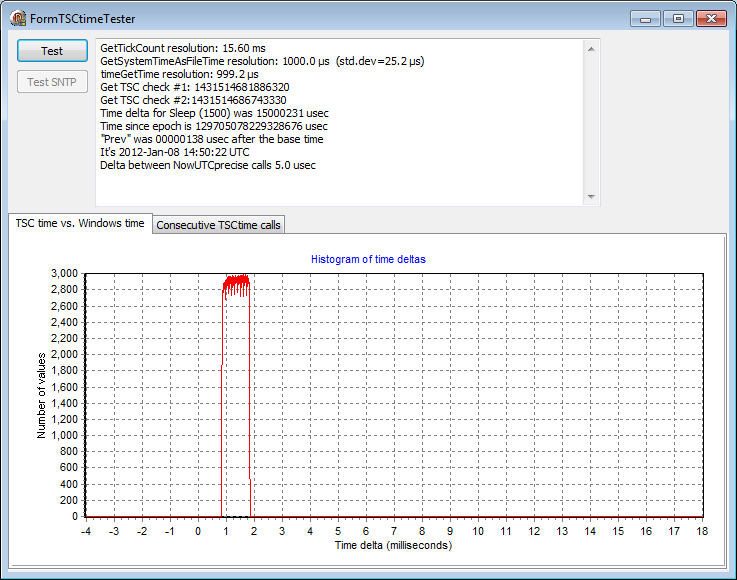
With this Windows-7/32 PC, the uniform 1 ms second distribution always
started within the 0..1 ms interval.
PC Alta - Windows-7/64 - Intel quad core
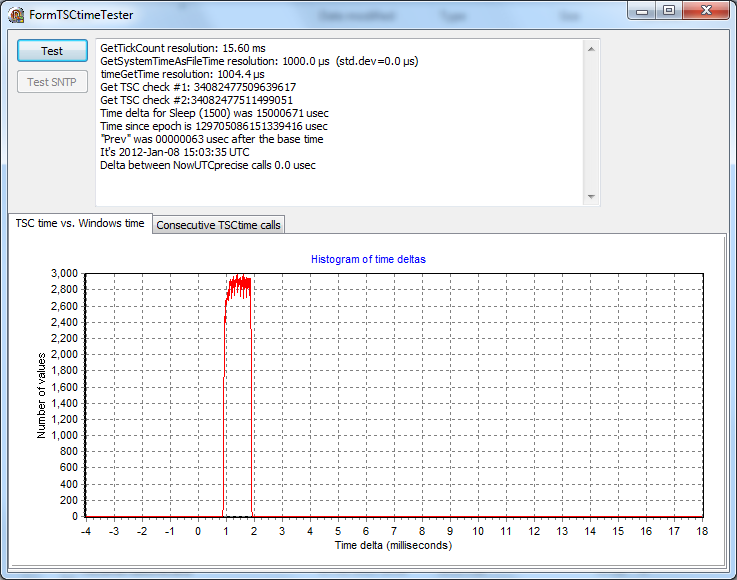
With this Windows-7/64 PC, the uniform 1 ms second distribution always
started within the 0..1 ms interval.
PC Hydra - Windows-7/64 - AMD single-core
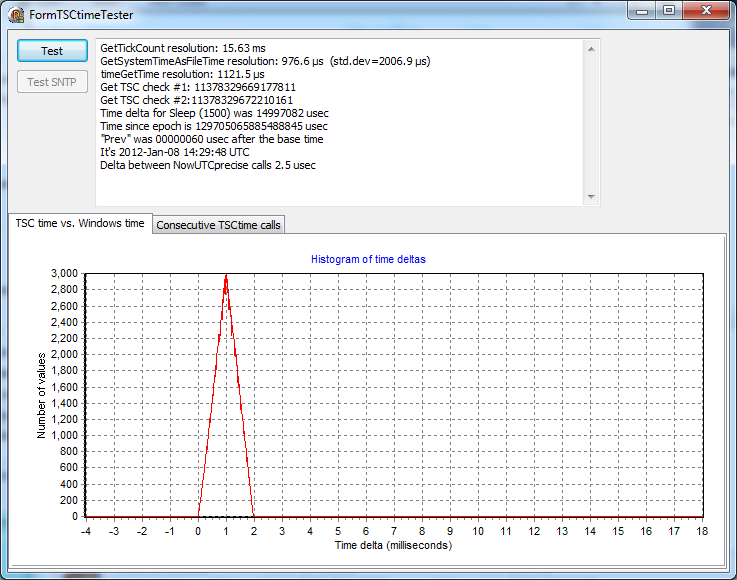
PC Bergen - Windows-8/32 - Intel T5450 Core 2 duo
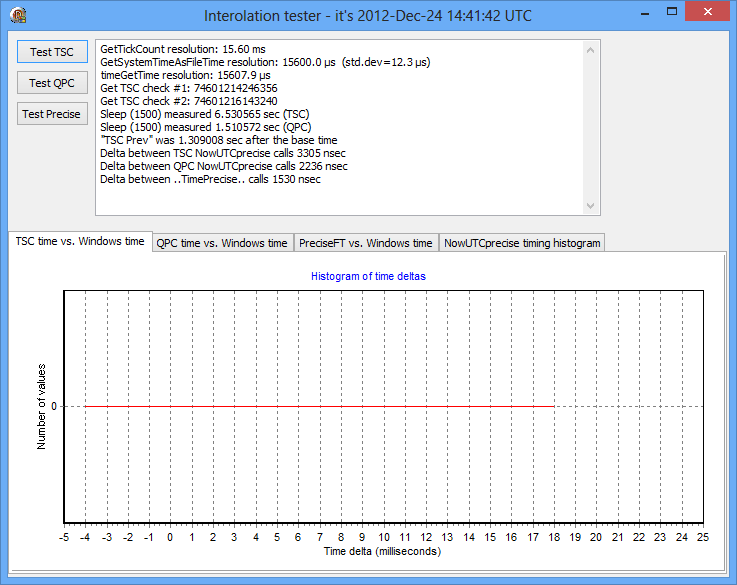
Don't
know why this graph is flat. The Sleep (1500) values look strange,
measuring 6.5 seconds with the TSC in this test instead of about 1.5 seconds,
but only 0.44 seconds and 0.48 seconds in the two tests below. It appears
that the routines using TSC are unreliable under Windows-8, so it's best to use
the QPC ones instead. A retest after a number of updates, but before
Windows-8.1 shows the same flat-line graph. This problem remains to be investigated.
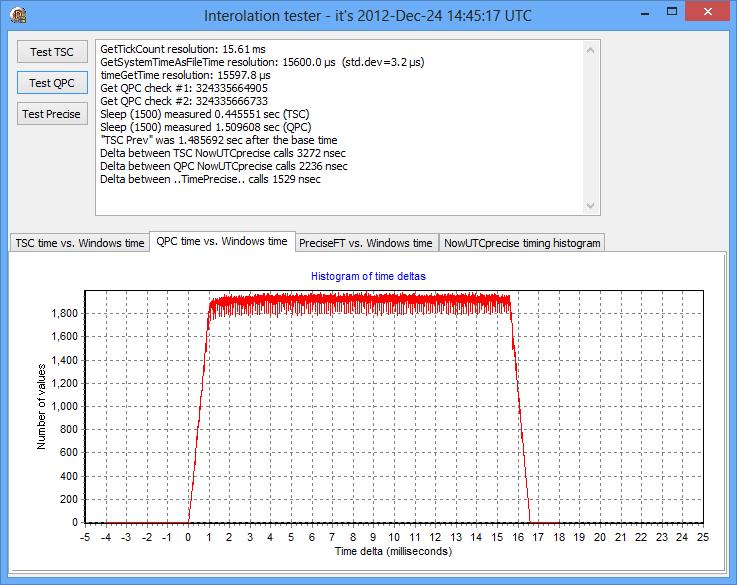
Same as above except using QPC version instead of TSC version.
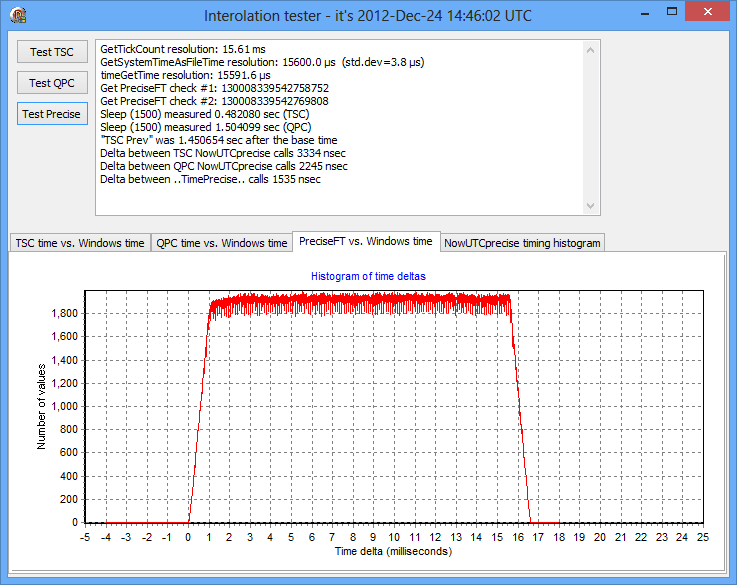 Same
as above except using Win-8 GetSystemTimePreciseAsFileTime function call version
instead of TSC version.
PC Stamsund (new build) - Windows-8/64 - Intel i5-3330 quad core
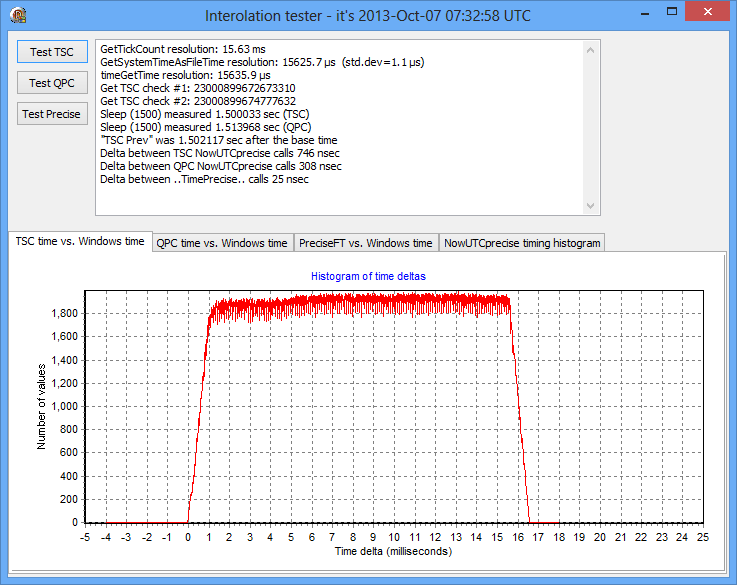
This shows much the expected results, with the correct value for the sleep
(1500) call. Why this is correct and PC Bergen not, I don't know.
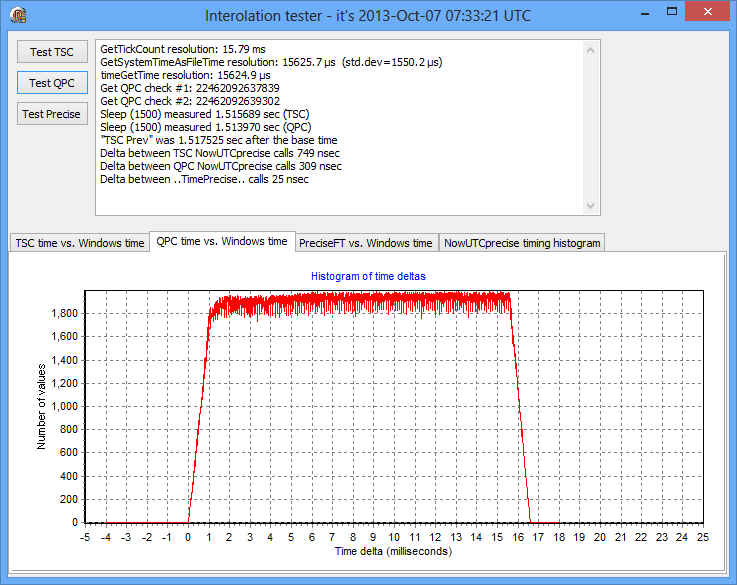
Same as above except using QPC version instead of TSC version.
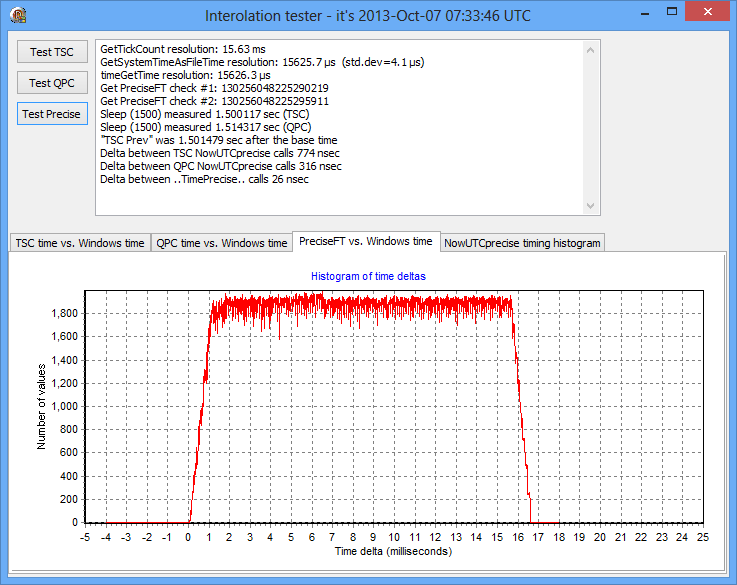
Same
as above except using Win-8 GetSystemTimePreciseAsFileTime function call version
instead of TSC version.
Routine: NowUTCfromGetSystemTime - (actual name: NowUTC)
function NowUTC: TDateTime;
var
  system_datetime: TSystemTime;
begin
  GetSystemTime (system_datetime);
  Result := SystemTimeToDateTime (system_datetime);
end;
Routine: NowUTCfromTSCinterpolation - (actual name: NowUTCprecise)
function NowUTCprecise: TDateTime;
begin
  Result := NsTimeToUTC (gethectonanotime_norecal);
end;
function NsTimeToUTC (ft: UInt64): TDateTime;
var
  dt: TDateTime;
  offset: TDateTime;
begin
  dt := ft;
  dt := dt / (1E7 * 86400);
  offset := EncodeDate (1601, 1, 1);
  Result := dt + offset;
end;
function gethectonanotime_norecal: UInt64;
// Get current time, without recalibration
var
  curtsc: UInt64;
begin
  // Get the timestamp right up front
  curtsc := gettsc;
  Result := hectonanotime_of_tsc (curtsc);
end;

function gettsc: UInt64; register;
asm
  db $0F, $31
end;
function hectonanotime_of_tsc (curtsc: UInt64): UInt64;  inline;
// compute seconds and hectonanoseconds separately to avoid overflow problems
// deltaticks may be negative if we're measuring first and calibrating later
var
  neg: boolean;
  deltaticks, deltasecs, deltafrac, delta: UInt64;
begin
  neg := curtsc < basetsc;
  if neg
    then deltaticks := basetsc - curtsc
    else deltaticks := curtsc - basetsc;
  deltasecs := deltaticks div tscfreq;
  deltafrac := (ftTicksPerSecond * (deltaticks mod tscfreq)) div tscfreq;  // in hectonanoseconds
  delta := deltasecs * ftTicksPerSecond + deltafrac;
  if neg
    then Result :=  basest - delta
    else Result := basest + delta;
end;
|