Part 1 - Zone Plate Images
Part 2 - Frequency Chart
Introduction
<to be done>
Information supplied by Dave Martindale: davem@cs.ubc.ca
Full Resolution Zone Plate
The first, called 64kpix.png, is a straightforward 256x256 zone plate image. It shows sine waves whose frequency is zero in the centre, increasing to 0.5 cycles per pixel (the maximum that can be represented without aliasing) at the edges. It represents the maximum spatial resolution possible with a B&W sensor of this size. Note that in the corners, the spacing of the lines is finer than at the middle of the edges, because the resolution limit is higher there.
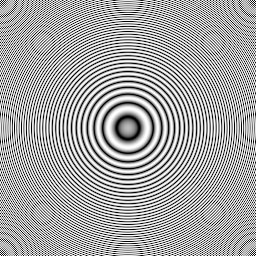
64kpix.png
(Make sure you view this at 1:1 or larger on screen; the downsampling algorithms generally used for reducing images for display will make a real mess of this. Even at 1:1, the difference between theoretical point reproduction and the actual Gaussian-shaped pixels with area that a CRT has will make a mess of displaying the corners.)
[I have made a simple, experimental Zone Plate Generation program available - DJT]
Resized Zone Plate
The next one, called 32kpix.png, is the original image shrunk in size by a factor of sqrt(2) and then enlarged back to the original size. The resizing was done by a very high quality filter that prevented most aliasing when the image was shrunk, and retained almost all information when it was enlarged again. The intermediate image was 32 kpixels (181x181) in size, and this image fairly represents how much of the detail of the original image could have been captured by a smaller sensor. As you can see, the lower 2/3 of the frequency range is preserved intact, while the upper 1/3 of the frequency range at the edges of the original image just turns into grey since it cannot be represented properly in the smaller image. In total, about half the area of the original 64 kpixel image has become grey, because half of the frequency content of the original image could not be represented in the 32 kpixel version.
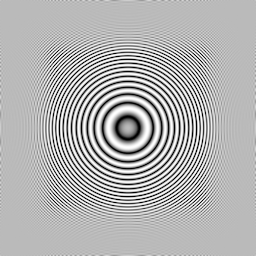
32kpix.png
Also note that the shape containing the frequencies that are still representable is roughly square, and that the corners of this shape contain higher frequencies (smaller line spacing) than the horizontal and vertical edges. This is a simple consequence of the fact that the resolution limit of the smaller 32 kpixel image is higher for diagonal lines than for horizontal or vertical lines.
Rotated Zone Plate
The third image, called 32krot.png, is also a 32 kpixel image produced by shrinking the original and enlarging it again. However, this time, a 45 degree rotation was applied during the shrink, and a -45 degree rotation during the enlargement. This models capturing the image with a rotated sensor grid like the Fuji camera uses. Note that again about half the area of the image is flat grey because the 32 kpixel image couldn't represent those frequencies in the original, and that again the area of frequencies that survived is square in shape, and the same size as in 32kpix.png. So this image doesn't contain any more total information than 32kpix.png.
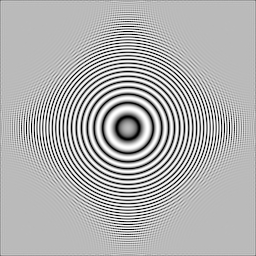
32krot.png
The only difference is that the square-shaped region of frequencies that are preserved is rotated 45 degrees. Because of this, horizontal and vertical frequencies almost out to the edges of the 64 k image are preserved, while 45 degree diagonal resolution is only half of the original image.
So a 32 k image taken with a rotated sensor can have essentially the same horizontal and vertical resolution as a 64 k image taken with a normal row/column oriented sensor, but you lose half of the possible diagonal frequencies that the 64 k sensor could have captured. The 32 k non-rotated sensor captures about 2/3 of the frequency range of the larger sensor in all directions.