Real-time
Audio
Spectrum Analyzer
Use your Sound Card
and the
"Audio Test Set" from SatSignal Software
| Output Features | Generate sweep tones, continuous tones, sinewave, triangle, white & pink noise |
| Input Features | Vectorscope, time domain scope, spectrum analysis |
| Analysis Features | Tracking Generator sweeps output tone and measures input in full duplex |
| Measurement Uses | Measuring balance, frequency response, filter characteristics, microphone response, speaker output quality, finding noise floor in audio devices, and more |
| Educational Value | Learn about Audio devices, how to evaluate quality, dynamic range, distortion |
| Compare Prices | If you price
a bench-top Audio Spectrum Analyzer with Tracking Generator you'd see they
cost literally thousands of dollars.
With your full duplex sound card, and the Audio Test Set you can do almost all of the audio analysis you can with an expensive Audio Spectrum Analyser. It's free! Download here. You may also need to download and install my runtime Library Bundle if you don't already have it. I've added an RTF version of the Help file for newer Windows systems. If you like it, you can register it as a "thank you". |
![]()
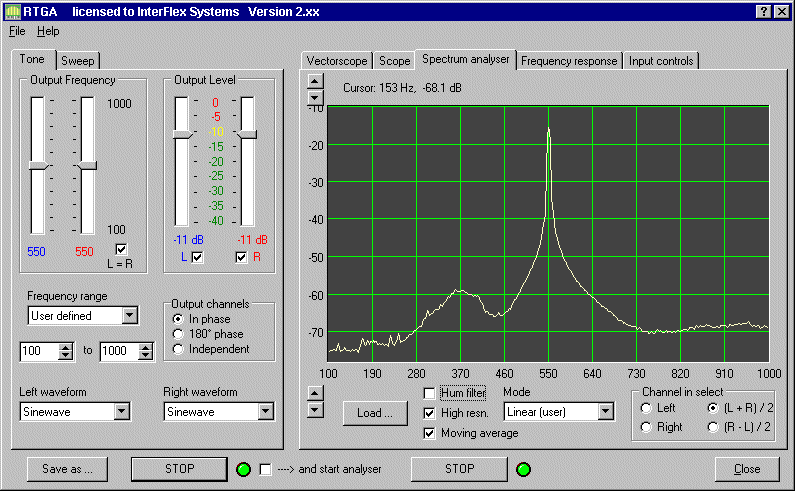
This is a view of
the Real Time Generator/Analyzer Screen
The audio is a single
sinewave Tone, at 550 Hz
The Tone is coming
out of the speakers attached to the sound card
The Analyzer input
is the MIC input
Notice the peak
at 550 Hz, with an apparent roll-off
The roll-off is due
to the bandwidth of the Analyzer
The Hz scale (Horizontal)
has been widened (user defined)
to show that even
at about 50 Hz on either side of 550 Hz
the signal shown
is about 40 db down from the peak.
![]()
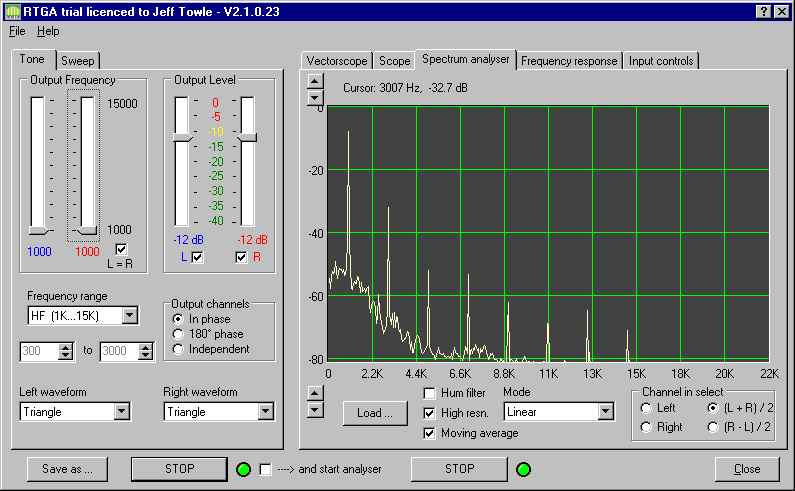
This is a single
tone, but the waveform is a TRIANGLE.
Notice the harmonics
appearing at 3, 5, 7, 9 ... times the base 1 kHz
The left side of
the program is generating audio which is being played
into a cheap set
of speakers, using max audio volume and midrange
wav level, and midrange
treble and bass. This audio then goes into
an inexpensive microphone
with 20 db gain set, maximum level
One user noted that
this spectrum plot looks more like a square wave
than a triangle,
so we are assuming that the speaker, microphone and
settings used have
distorted the triangle into more of a square wave
The sound card mixer
settings are obviously important
and the characteristics
of the output and input devices
are also going to
affect the measurements.
Sound card is a Creative
Labs Sound Blaster Live Value card
Speakers are some
inexpensive MS 691 Multi-Media 2" speakers
Microphone is a
Labtec AM-242 plastic boom mic
![]()
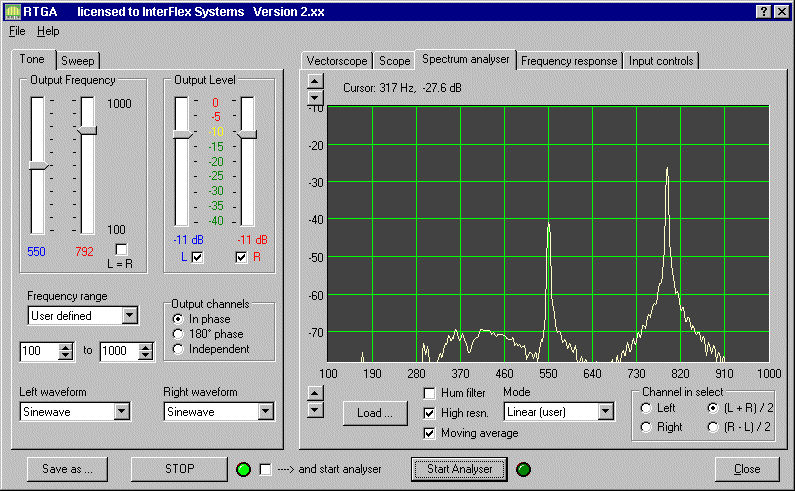
This is a pair
of tones. The Left speaker is about 6 inches from the mic
and the Right speaker
is about 1 inch from the mic
Notice the relative
amplitude of the two tones, showing the lower amplitude
of the 550 Hz tone,
which could be due to (1) the distance of the speaker from the MIC
and/or (2) the frequency
response of the speaker/mic combination
![]()
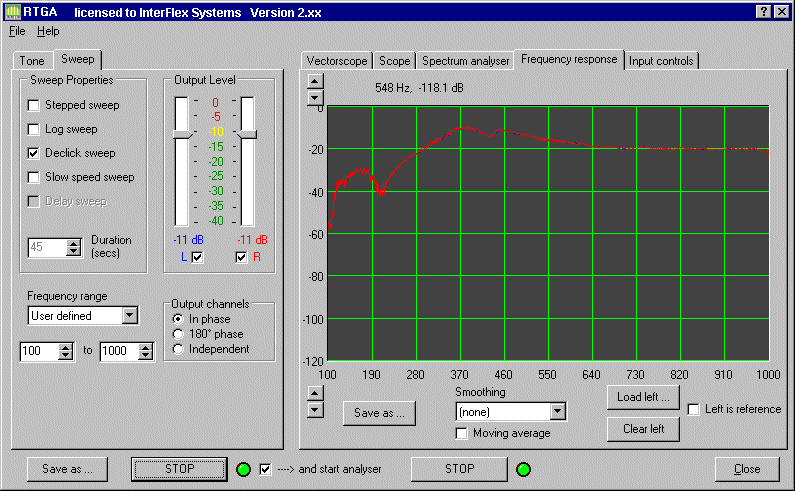
This is a sweep
tone from 100 Hz to 1000 Hz, and the frequency response of the speaker/mic
system on my computer.
Notice the ramp up to about 175 Hz, a roll-off, then
a steady rise to
about 370 Hz, then a roll-off to -20 db from 550 Hz to 1000 Hz
Note: In this mode,
the Tone Generator and Spectrum Analyzer are "Tracking"
This is useful for
testing frequency response characteristics
![]()
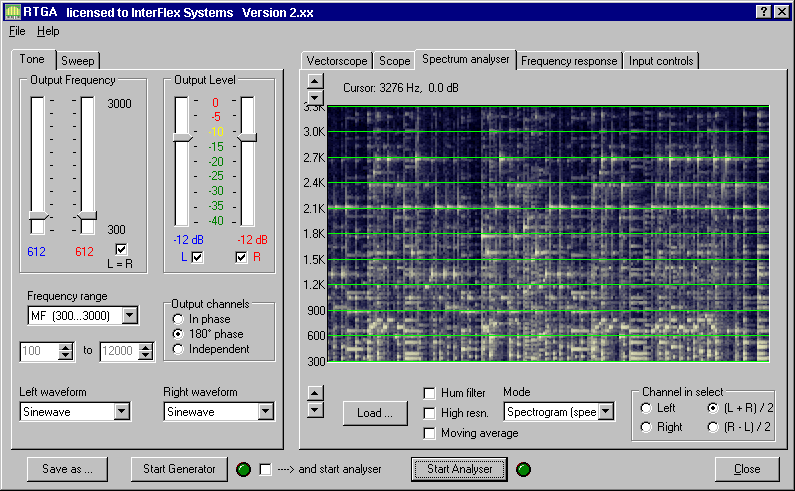
This is a spectrogram
of some piano music called
"The
Entertainer"
--
Here's what you're
seeing in the spectrogram:
The horizontal axis
is time, the display is "sliding" to the left over time.
On the vertical
axis is "Energy" at the frequencies indicated
--
Notice the energy
comes on the "beats" in the music
and you can see
the notes played are repeated
Listen to the clip
(link above) and look at the spectrogram
You'll get an idea
of what this display means